
XJO WEEKLY Price structure:
IMPORTANT DISCLAIMER
The information in this report is of a general nature only. It is not personal financial product advice. It does not take into account your objectives, financial situation, or needs. You should therefore consider the appropriateness of this general information in light of these. The Australian School of Technical Analysis (www.astatrading.com) recommend that you refer to the Product Disclosure Statements of any financial products which are discussed in this report before making any investment decisions. ASTA accepts no responsibility for your actions and recommends you contact a licensed advisor before acting on any information contained in this general information report.
A very strong range following the lower retest of the 6400 level. The current impulsive price bar, often forcing a short cover gave the Index one of the best weekly gains for some 20 months. Weekly ranges can be used to develop mid-range support levels, (the October 2020 low is another example). The primary trend is down a further movement below the midpoint would give first warning of a move too or below 6400, this would further confirm that trend in place.
Indicator: Relative strength 14:
Relative strength has again closed below the 50 level as part of the overall decline in relative strength. Price momentum turns negative on the lower side of 50. However, should Relative strength move above the key 50 level a sign of improving price momentum would prevail.

Comments from Last week: The close of this week is exactly equal to the close late June, this may be setting up a double bottom support level. This can be resolved for direction very quickly should the index close below the 6474 level and more importantly below the 6400 level. The primary trend is down a further movement below the 6400 would further confirm that trend in place.
XJO DAILY Price structure:
The Daily chart shows the strong advance for the earlier FO (fake-out) currently an early Bearish reversal point in the form of a pivot point is displayed. This confirms another lower
high compared to the previous pivot point set on the 14 th September. The first intimate support level is 6765, an immediate break of this level would bring the Weekly chart midpoint into play.
Indicator: Relative strength 14:
The Relative strength Indicator (14) reflecting the underlying price momentum has moved lower to the 50-level indicating weaking momentum. Relative strength is moving in sync with the trending action of the market and does not offer any trading signal other than indicating momentum is currently to the downside.
Indicator: VOLUME:
Friday 3/10 higher volume bar was developed from the inside range bar moving lower, high turnover bars that do not have impulsive ranges (large) can begin to represent a base beginning to build. Friday 3/10 volume measured over $1B. However last Friday set the lowest volume for the week, indicating a lack of conviction for further buying. Only volumes over 1Bil on a Daily basis would indicate strong new money buying.
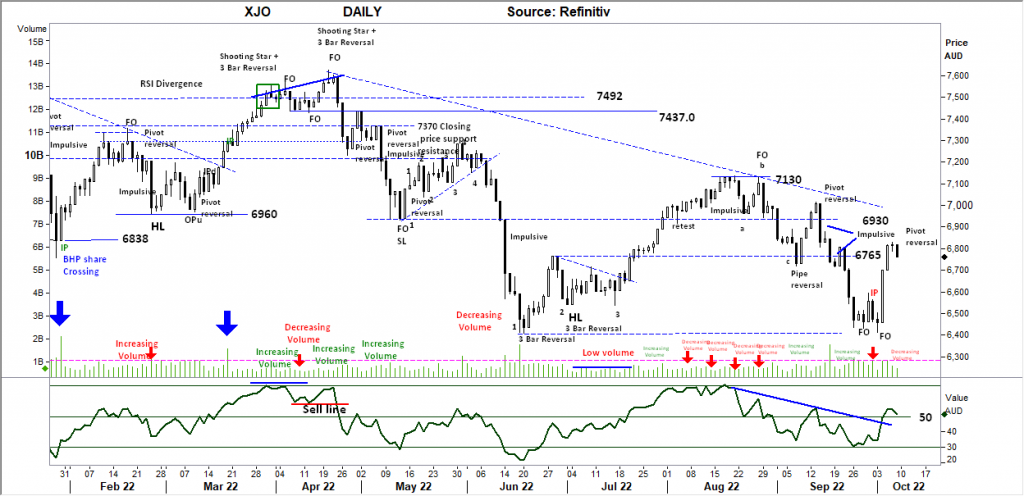
Comments from Last week: Last Wednesday the Index showed a fake out low (FO) followed by the sharp rally Thursday with no follow through indicated by Fridays inside period (IPd). A price movement either side of the Friday IP will give some indication of direction in the coming days. A break of the Wednesday low would signal continuation, however this would be the place to find support considering the volumes traded (see below)..
S&P 500 WEEKLY Price structure:
The current inverted hammer bar when displayed in a weekly chart is a bullish signal, often with a lower price being set first then followed by a rise in price. This is the important level (3600) to achieve that outcome result. The current Weekly bar also completes a 3 Bar reversal pattern, a close over 3795 will confirm the pattern. The Weekly trend remains down.
Indicator: Relative strength Indicator 14.
The reading below the 50 level again sets up the sell signal, last week the indicator turned higher, indicating a change in momentum, this week may ultimately continue the momentum move. A movement towards and over the 50 level would be a very strong short term bullish signal. Positive momentum requires a reading above the key level of 50.
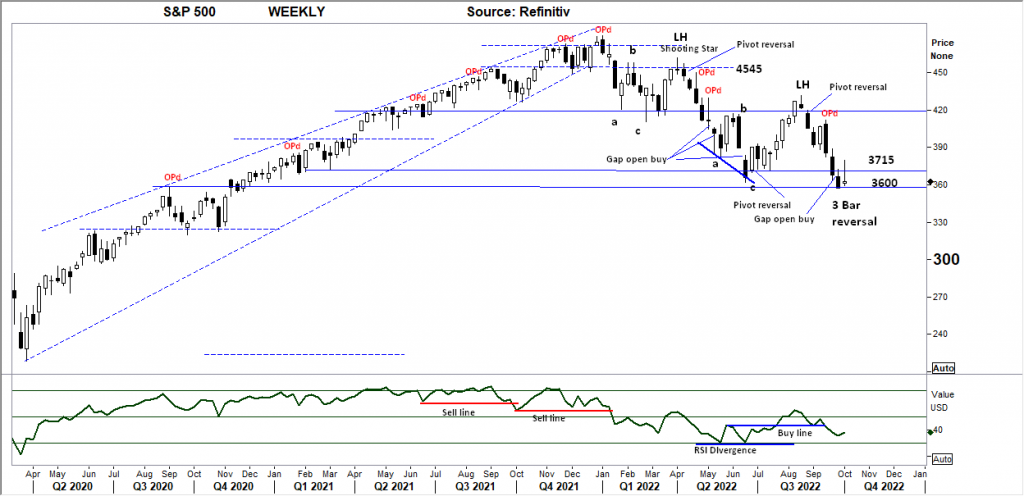
Comments from Last week: A solid weekly close towards the low lend a strong signal of continuation, the close is below the 3600 support level indicating the sellers are in control. No current signals of reversal from this level are showing inside the primary down trend. The standout observation is the range of the weekly bars are very strong compared to the 2020- 21 period of short upward movements indicating strength of momentum underway.
S&P 500 DAILY Price structure: Developing bullish structure has failed.
Resistance is confirmed at the 3800-level following the inside range (IP), last Friday’s pivot point reversal and remains a Bearish signal for further declines and further confirms the
short term high point (LH) in place. The immediate support is 3620 with critical support shown at 3567. A further breakdown below this level will further confirm the Weekly Primary down trend.
Indicator: Relative strength 14:
Relative strength has turned lower while below the 50 level, a very strong indication of immediate loss of momentum. Further price weakness for this index will see the RSI move lower. This remains the area to monitor for a bullish divergence signal.
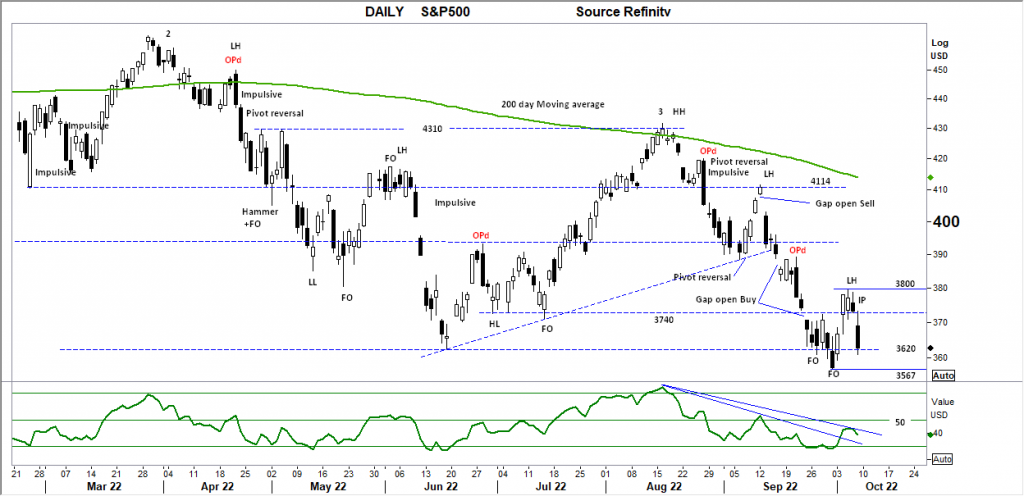
Comments from Last week The daily chart better displays the intention of the market to move lower with a solid close below the previous few days consolidation. A bear trap would be indicated with an immediate close back over the 3630 level. However, momentum is strong to the downside with continuation expected. Targets around 3400 are feasible in this current move lower
NASDAQ DAILY Price structure: Primary DOWN Trend remains
In line with the other major indices the Nasdaq Daily displays an outside period (OPu) reversal signal that has further developed into an Island top reversal pattern confirmed with the gap lower last Friday. The island top indicates a bullish trap for buyers and often leads to further stop loss selling. Immediate support is located at 10966, if a further close occurs below this level, further confirmation of the daily down trend will remain.
Indicator: Relative strength 14:
The Relative strength indicator moving back towards the 30 level a signal of slowing / negative momentum. With a continuing move, the indicator may cross lower below the 30 level, price movement will remain negative with a continued reading below 50.
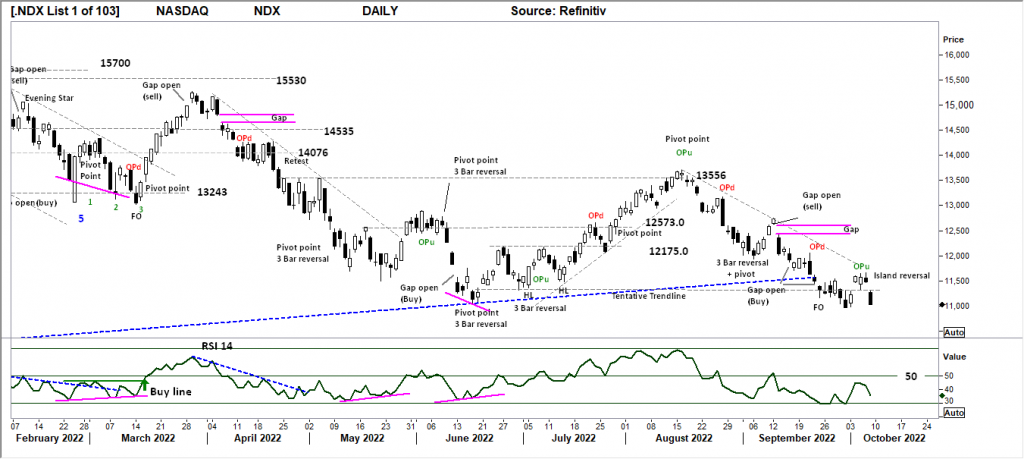
Comments from Last week: The repositioned tentative trend line ( redrawn off the low of the Wednesday pivot reversal bar) has provided no support for the current decline in price. With the primary trend remaining down, last Fridays movement has confirmed the potential for a move lower into the 10,000 point level.
USD Spot GOLD – DAILY: Is it close to a Bull market? Answer = developing trend
The $USD Index moving higher (see below) has seen a reversal in the Gold price, the current daily pattern developing into a bullish flag. The overall pattern from late August is developing into a Head and Shoulder reversal that will only be confirmed with a breakout above and followed by a successful retest of the neckline around $1740.0.
Indicator: Relative Strength 14:
Price momentum is again working lower as the bullish flag develops, the RSI moving below the 50 level is the signal of weakening momentum. (Currently 50.31) (Price consolidation would naturally see the RSI drift back too around the 50 level. A strong movement either way will show the next directional move.)
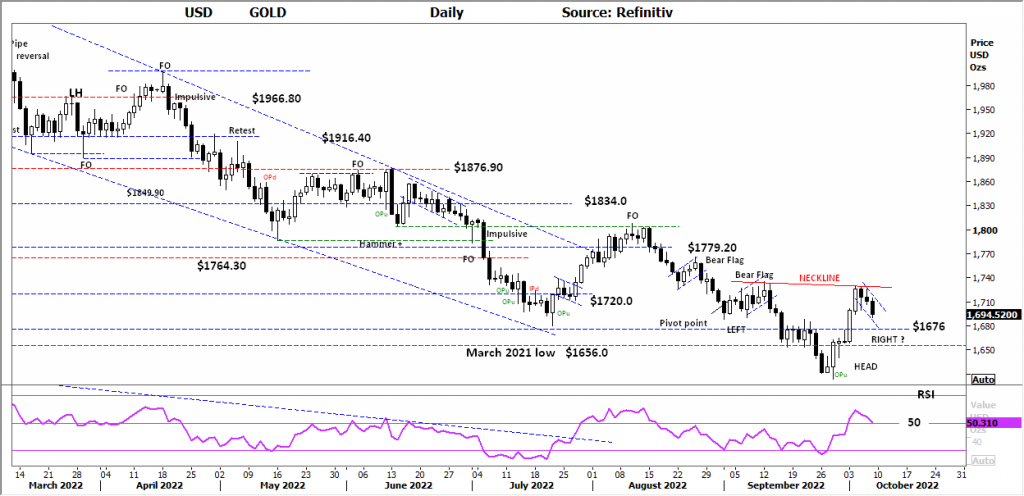
Comments from Last week: Resistance of 1676.0 remains supreme with the final bar rejection back to $1656 support. Bullish divergence in price remains in play following last Wednesday’s OPu bar a larger range and key reversal bar. The primary trend remains down, to confirm any level of support in the coming days a close must remain above the $1656.0 level.
SILVER DAILY Price structure: Bull market? – Not yet but almost.
Silver displays the Fake out move (FO) followed by the inevitable decline, the overlapping nature of the decline constitutes a secondary movement in this case a Bullish flag pattern.
This pattern following the higher low (HL) and impulsive price movement is a very strong signal of a Primary trend UP developing.
It is acknowledged the COT report shows a “net long” positioning of traders.
Relative strength 14:
Current Relative strength is rolling lower (again) with the movement crossing the 50-level, RSI turning higher again would reflect the underlying momentum again turning positive. A continuing move above the 50 level and higher would be very bullish signal in the short term. Price consolidation results in the relative strength turning towards the 50 level.

Comments from last week:
As with Gold, an OPu bar is present in the Daily silver chart. As the OPu is a reversal bar the low point has set a higher low than the late August low, and possibly signalling the change in Daily trend is underway. Last saw rejection of the $19.0 level, this will be the goto level in the coming days a close over this level would give a string indication of further gains to come.
AUD GOLD DAILY Price structure: Breakout.
For Australian Gold producers this is the most important chart, it indicates their selling price and ultimately the difference between the selling price and cost of production – margin.
$AUDXAU has currently moved back to the first key resistance level of $2676, the chart highlights the current USD Gold price and the $AUDUSD value. Only a lower $AUD will get this across the immediate resistance level. Current pricing bodes well for the Australian producers margins.
Indicator Relative strength 14:
Relative strength has turned higher from above the 50 level to move above the 70 level, thisshows a significant increase in positive price momentum and remains a strong indication for
further advances.

Comments from Last week:
The strong impulsive move higher on Friday thanks to a weaker $AUD, but nonetheless an IMPORTANT DEVELOPMENT for undervalued AU$ Gold producers to finally make a move higher. This development in the AUDXAU price put the index into a Primary up trend and may gather further upside momentum in the coming days..
COPPER DAILY Price structure: “V” recovery failed.
The current inverted Hammer bar is a bullish signal, traders should be aware a lower price is required first. Copper is consolidating around the $3.47 level and importantly above the
long-term trend line. A further close above the $3.47 level and above the $3.80 would confirm a bullish move is underway. Should a break of the previous low set on the 15 th of July occur a bearish signal would develop, importantly a break of the trendline would bring in Stop loss selling.
Indicator: Relative strength 14:
Current reading has swung from below the 30-level to again turn sideways to higher as downward momentum has slowed, however the current reading remains below the key 50 level.
The key now, is for the RSI to swung back above the 50 level as a reflection of ongoing price gains. A sharp cross of the 50 level is required to offer a strong buy signal.
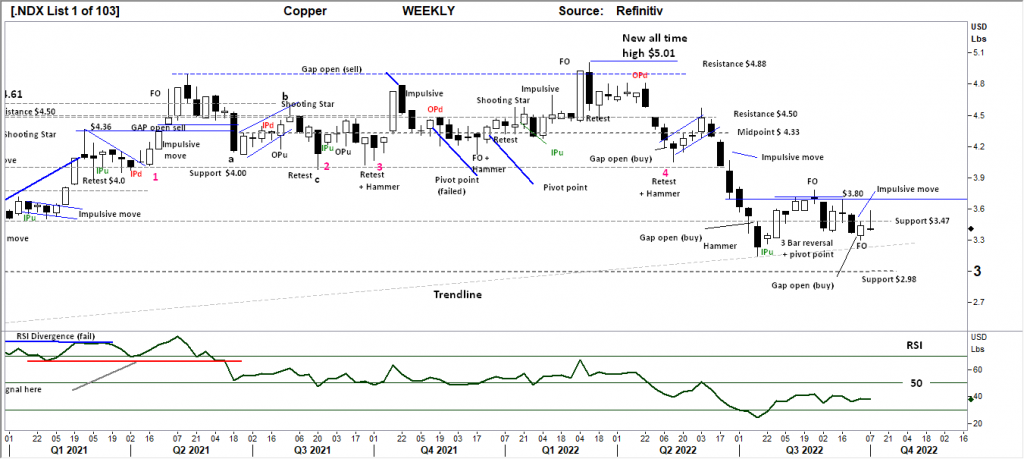
Comments from Last week: The Weekly chart for Copper indicates a Monday gap open buy signal resulting in a higher close. But the close is below the $3.47 resistance level. At best Copper is consolidating below this key level. A further breakout higher is required to change trend, but it should be noted the impulsive bar of 2 weeks ago has not followed through lower
AUSTRALIAN VOLATILITY INDEX:
Volatility reading has moved lower from the mid-week high, and remains above the 13 level indicating forward pricing of PUT options remains strong. In general, lower equity prices or consolidation of equity prices is indicated as the reading remains above the 13 level. For continued support of equities, the XVI should move below the “13” level.
The cost of 3month forward PUT options is decreasing from recent elevated levels.
The XVI is the difference between 3-month forward pricing of ETO Options against current month. As markets anticipate events, the forward priced option volatility changes, hence as forward price changes, this “skew” in pricing is measured in this XVI. The XVI value works as an inverse observation to the underlying market.

Comments from last Week:
USD DOLLAR INDEX Price structure:
The $USD has reasserted a Primary UP trend move, following the retest towards the 109.47 level. This will place pressure back on PM commodities (read Gold and Silver). The chart will
now be monitored for a potential “lower high” and further breakdown of the previous 110.05 closing low.
Indicator: Relative strength 14:
The Relative strength has turned higher in line with price movements indicating a increase of upward momentum and should now be monitored for further consolidation as the current reading is below the 70 level. This will move lower to sideways should price decline, only a continued reading back above the 70 level would indicate continuing strong price momentum.
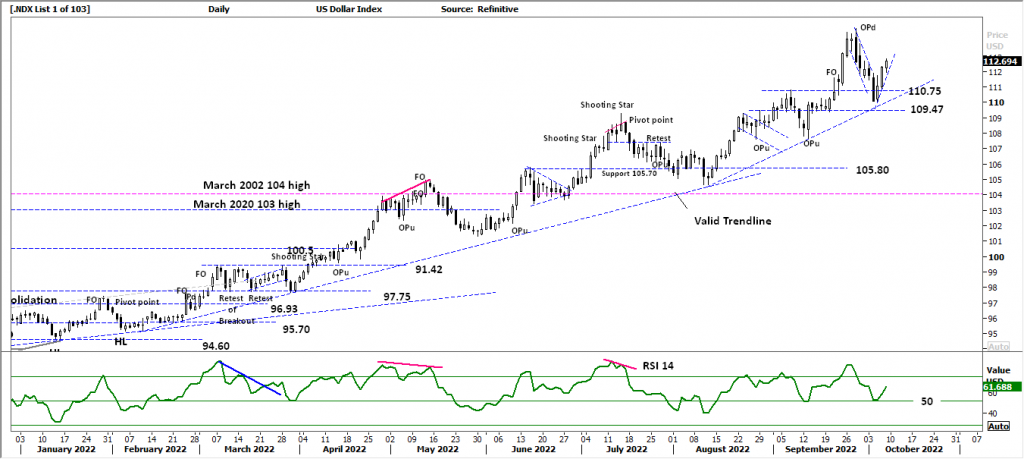
Comments from Last week: The king is dead, long live commodity prices! The OPd (outside period) is a significant development to mark the high point. The current first support level is 110.75. This is not a change of trend, a lower high is required that may take time to develop. This is the key reversal signal to watch in the coming days, a close back over the 115 level would negate the view of a top in place.
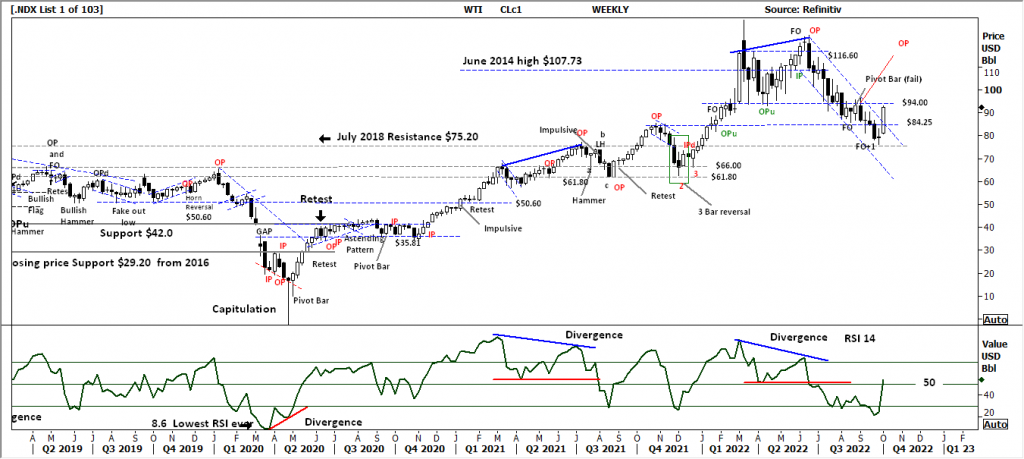
WTI – CRUDE OIL, Price structure: Full Bull Market remains-just.
This commodity is highly news driven around supply -demand.
The current breakout of the downward movement channel a result of Saudi production cuts (news) is retesting the $94.0 support / resistance level. As the Weekly range is a large compared to the previous ranges the move is impulsive and suggests further upside should a breakout occur over the $94.0 level a retest of the highs would be underway.
Indicator: Relative strength 14:
The RSI running below the 30 is a result of strong price declines as upward momentum slows, price reversal has resulted in a sharp movement over the key level of 50 signalling increasing positive price momentum. This current move will only be confirmed with an RSI reading remaining over the 50 level.


 Access +10,000 financial
instruments
Access +10,000 financial
instruments