
Markets remain risk off with a solid week of selling in Major indices. The Nasdaq wipes 12 months of gains, the upside at the end of last week was a small Bullish divergence signal developing, an early week relief rally may be in the offering.
US Federal reserve board members remain hawkish for further interest rate rises, ongoing commentary around these announcements has kept the markets volatile.
Gold and Silver and Copper continue to test lower support levels with Silver at risk of a further momentum move breakdown below the $22.0 support level.
XJO WEEKLY
Price structure:
As discussed last week, a solid sell down has occurred with an expanding range, the closing level meeting the confluence of the longer term Trendline and the key support level of 7200. The 7200 level has remained a key support level over the past 12 months. The next support level is shown at 6960 points. From August 2021 and December 2021 and recently during April 2022 the market has set 3 significant high points with a reversal underway as part of this broadening top formation.
Indicator: Relative Strength 14
Relative Strength has closed below the key 50 level. Price momentum turns negative. A further swing above the 50 level would signify positive momentum.
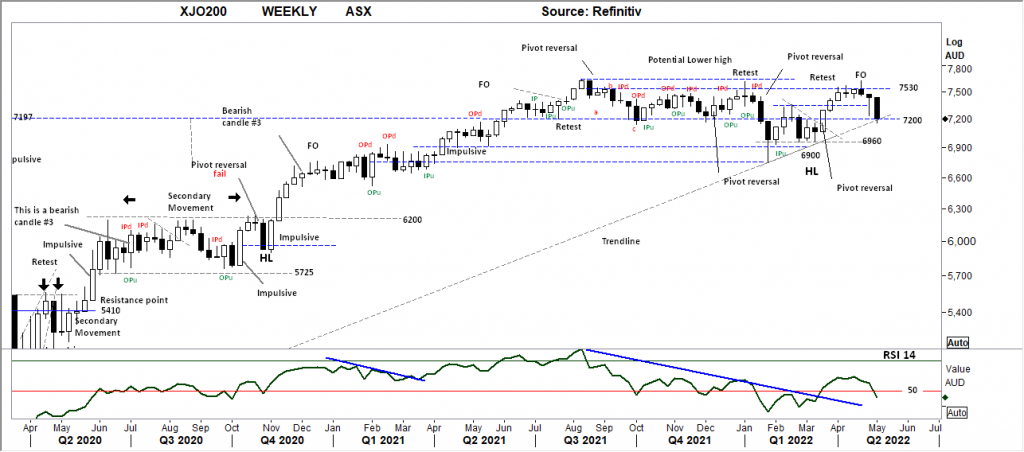
Comments from last week: The Fake out bar of 2 weeks ago has followed thru with last week’s retest towards the 7200-level last week. The market has traded towards the long term trendline and looks set to trade lower with a break of the 7200-support resistance level being the first signal for a retest of 6900 points. The expectation is for this market, heavily weighted with 4 banks and several large resource stocks to trade lower in the coming week but remain within the past 15 month consolidation range between 6820 and 7530 points. The underlying Primary trend remains UP.
XJO DAILY
Price structure:
The Daily chart highlights how “Technical” the market has become as resistance levels (7437) and support levels (7216) have influenced price movement. Further breakdown of price has the potential to test the 6960-support level set during February – March period this year. With the current movement setting a Daily downtrend in place, a continued move lower would put the higher time frame Weekly chart into a corrective move.
Indicator: Relative Strength 14
The Relative Strength Indicator (14) reflecting the underlying price momentum has moved lower from below the 50-level indicating a shift to weakening momentum.
Indicator: VOLUME
Trading volumes have remained buoyant and have been increasing during the past week leading again to Friday’s high volume close, volume will be monitored for any further increase as a signal of “risk off” taking the market lower. Strong volumes over 1Bil on a Daily basis would indicate strong buying/selling recent Friday sell offs are reaching that level.

Comments from last week: Late last week the strong recovery from the initial retest of the 7200 level has closed at the high but also closed below the 7437-resistance level. The market is expected to trade lower on open this week, so key levels of support should be monitored to gauge market sentiment. The first is 7216, a close below this level would send a very bearish signal to investors and may invoke a momentum move lower into the 6900 level. As the Relative strength is moving over the key 50 level, a further cross below this level indicates further bearish price momentum.
S&P 500 WEEKLY
Price structure:
The S&P approaches a 12 month low as the 4050 level is again tested as support, the test and immediate rejection of the 4320 level mid-week is a significant bearish signal for further declines. The S&P 500 has entered a Primary down trend, however Downtrends are also made up of price retracements, during any potential price retracement this week the first resistance level is 4200, this level should be monitored for a close over this level as a signal of a further advance.
Indicator: Relative Strength Indicator 14
Price movements are considered positive with a reading above the 50 level, with this continued reading turning below the key 50 level indications that price momentum is slowing, an ongoing reading below 50 would confirm the continuing Bearish price movement in the price chart. The potential for an accelerated move lower remains as the momentum slows and moves lower towards the 30 level.
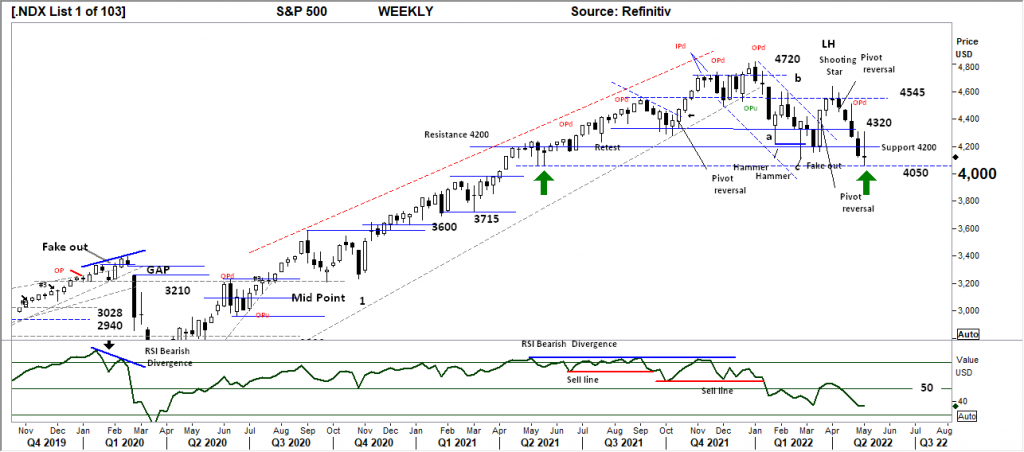
Comments from last week: The lowest close for the past 12 months. The S&P 500 has entered a technical down trend. Last week’s close at the low, indicates a lack of buyers at the close, this technical low close can lead to further selling as profits are protected and late buyers (12 months) are left taking stop losses. Basic DOW Theory infers markets are forward looking at the economy and potential for companies to show profits or not is now being priced in.
S&P 500 DAILY
Price structure:
The 4310 level has been tested twice with the current rejection decline setting a higher low on Friday’s close against the “Hammer” bar of last Monday. This second Hammer bar is a further bullish signal the closing price support remains at this 4144 level. See RSI notes, a higher low for the week may lead to a short price rally to retest the 4310 level. Any Daily close below the 4114 level would send a bearish signal and potentially test lower levels.
Indicator: Relative Strength 14
Relative Strength Indicator (14) has made a higher reading to close the week (as price makes a lower close) but remains below the key 50 level. An early Bullish divergence signal may be developing, this may play out to a short rally this week potentially to again retest the 4310 level.
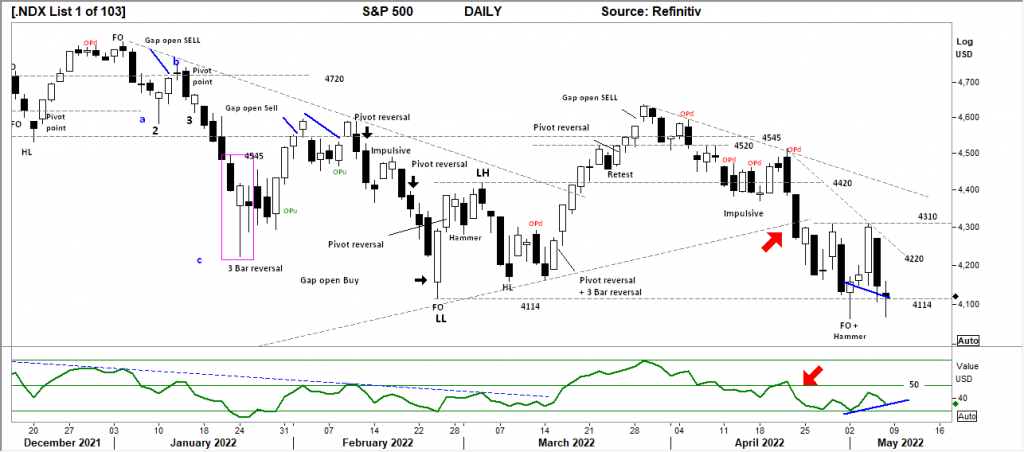
Comments from last week: Short day rallies are immediately being sold into; It is important to notice the range – high to low – is increasing on the down close days, this brings into focus the current selling pressure. The breakdown from the long term trendline was retested during the week with immediate rejection to retest the FO low point from late February 2022.
NASDAQ DAILY
Price structure:
The current Trendline breakdown has not been met with directional selling, rather a consolidation area has developed, the closing low on Friday although the low of the week is a short 142 points lower than the previous week. See RSI note.
Indicator: Relative Strength 14
Relative Strength has moved higher during the week but remaining below the key 50 level, indicating further bearish price momentum from the 14 day look back period. A Bullish divergence signal is developing indicating a shift in momentum as this current consolidation takes place.

Comments from last week: The Nasdaq displays the same rejection pressure as the long term trendline is broken and retested with the immediate reaction to trade lower. The Nasdaq has entered into a technical Primary down trend with further support levels at 12200 with the 10,000 point level as the current target point.
USD Spot GOLD – DAILY:
Is it a Bull market? Answer = No
From the first rejection of the $1916.40 level, it is important to note the strong sell down last Monday did not follow through to close lower. For the past 4 trading days Gold has set a secondary market consolidation again retesting the 1916.40 level with an important end of week close above the $1876.90 level. Price failing to find support at this level may see a further decline to test the Weekly trendline.
Indicator: Relative Strength 14
Price momentum has rolled sideways, the indicator continuing to move below the 50 level will be the critical observation again this week as a signal of decreasing price momentum that may continue to move lower below the 30 level.

Comments from last week: Precious metals being sold down in a general risk off event sweeping the markets. The past week again saw the $1916.40 level tested and rejected again. A price movement lower than $1876.90 will place Gold into a primary down trend. $USD Gold has the potential to retest the February 2022 breakout level shown at $1834.0 on further loss of momentum.
SILVER DAILY
Price structure: Bull market – Maybe not.
The continued sell down of Silver is viewed as a corrective movement, the lows of the past 5 trading days setting up a Bullish 3 point low consolidation pattern, (the 3rd point to be confirmed). Confirmation of this pattern should see an immediate rally to retest $23.50.
Indicator: Relative Strength 14
Current Relative Strength is moving below the 50 level and now below the 30-level turning higher shows price momentum is increasing. The RSI is developing a Bullish divergence signal against declining price. A continuing move below the 30 level and higher would be very bearish in the short term, and the potential for a further decline remains should price consolidate below the $22.50 level.

Comments from last week: A persistent sell down of Silver keeps the Bear market intact. What’s to notice about the right-hand edge of this chart is the inability of price to close higher on a daily basis. The breakdown of the $23.50 was briefly retested in the same session as the market closed on the lows towards $22.50 (target) The current OPd may indicate an ultimate swing point however further price consolidation is required above the closing low of $22.78 to initiate a bullish signal.
AUD GOLD DAILY
Price structure:
Potentially good support for the local producers as the XAU AUD puts in a pipe reversal during the week confirming support at $2600. The $2712 remains the resistance level in play.
Indicator Relative Strength 14
Following a mid-week “Dip” below the key 50 level, Relative strength has turned higher above the 50 level and moving towards the key 70 level indicating an increase in momentum. Relative strength may continue to track higher as price retests the 2712.0 level.
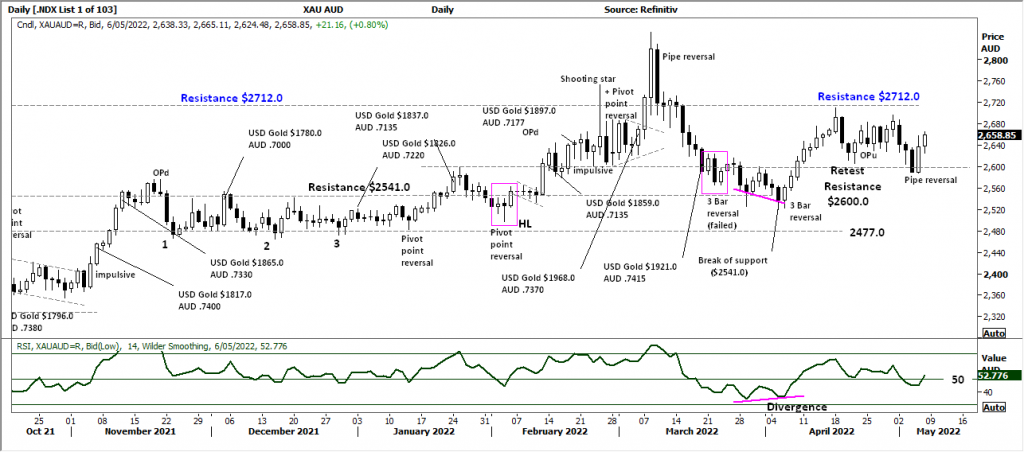
Comments from last week: Further consolidation in the AUDXAU price as the $AUD weakens along with the declining $USD Gold price. A break above the $2712 level would be a bullish signal for the local producers share price. The AUDXAU Gold price remains within a Primary UP trend, although consolidation periods can be extended the underlying support remains.
COPPER DAILY
Price structure:
Dr Copper, an indicator of Global growth and demand for goods has moved below the very important median level of $4.33. The current movement has the potential to retest the $4.00 level. Last week’s range has expanded from the previous week showing sellers in control.
Indicator: Relative Strength 14
Current reading has swung below the 50-level reflecting the current Primary move underway. The key for now is the RSI to move above the 50 level as a reflection of ongoing and any positive underlying positive price momentum.
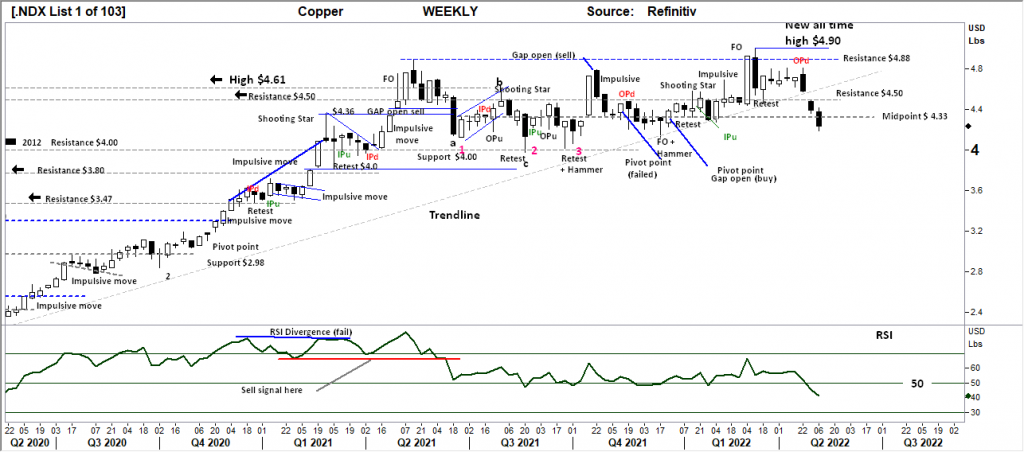
Comments from last week: Copper being sold down with the general risk off trade underway is not a positive signal of Global growth. Copper moving below the key $4.5lb level and closing towards the “midpoint” $4.33 level is a bearish signal for further declines. Copper remains within a large consolidation zone. A close above the $4.50 and $4.80 level is required to set a Bullish move underway.
AUSTRALIAN VOLATILITY INDEX
The sharp rise in Volatility this week has been the highest in seven weeks.
Rising volatility above the 13 level equals bearish equities.
The cost of 3month forward PUT options is increasing.
The XVI is the difference between 3-month forward pricing of ETO Options against current month.
As markets anticipate events, the forward priced option volatility changes, hence as forward price changes, this “skew” in pricing is measured in this XVI.
The XVI value works as an inverse observation to the underlying market. |

Comments from last week: The XVI value is expected to rise this week as forward protective risk is again priced in.
USD DOLLAR INDEX
Price structure:
The USD Index value has moved to a 10 year high, an expectation of consolidation between 103 and 104 before a move higher. The USD Index remains in a well-defined Primary UP trend that should see support remain at 103 to maintain a bullish view. A close below this level would indicate a short-term top in place.
Indicator: Relative Strength 14
The Relative Strength has turned higher in line with price movements and should now be monitored for further strength as the current reading over the key 70 level should move higher, a further reading above the 70 level would indicate very strong positive price momentum. The chart should now be monitored for a Bearish divergence signal.

Comments from last week: With the 103 target being met this past week; the current retracement has closed above this level to finish the week, a bullish signal during a consolidation. This move underway places pressure on the $AUD and ultimately improves the $AUD Gold price.
WTI – CRUDE OIL
Price structure: This commodity is highly news driven around supply -demand.
Solid consolidation above the $94.00 level sets up Oil to retest the highs over $116.60 resistance following this week’s closing price over $107.73. The WTI contract remains within a Primary UP trend.
Indicator: Relative Strength 14
The current price reversal has produced a higher low in the RSI, but the indicator remains above the key 50 level, a signal of price momentum, remaining positive. This will again be monitored for a swing below this key level. The Relative Strength crossing and remaining below the 50 level is regarded as a Bearish Indicator.

Comments from last week: Last week I commented about the potential for the WTI price to retest the $94.0 level. Although the price traded toward this level the current high close back above the $100 level remains a bullish signal for Oil in the week ahead. The $94.0 level remains the key level to hold as the current price consolidation takes place. A closing price over the $107.73 level would be a very bullish signal for further gains.


 Access +10,000 financial
instruments
Access +10,000 financial
instruments