
EUR/USD:
Monthly timeframe:
(Technical change on this timeframe is often limited though serves as guidance to potential longer-term moves)
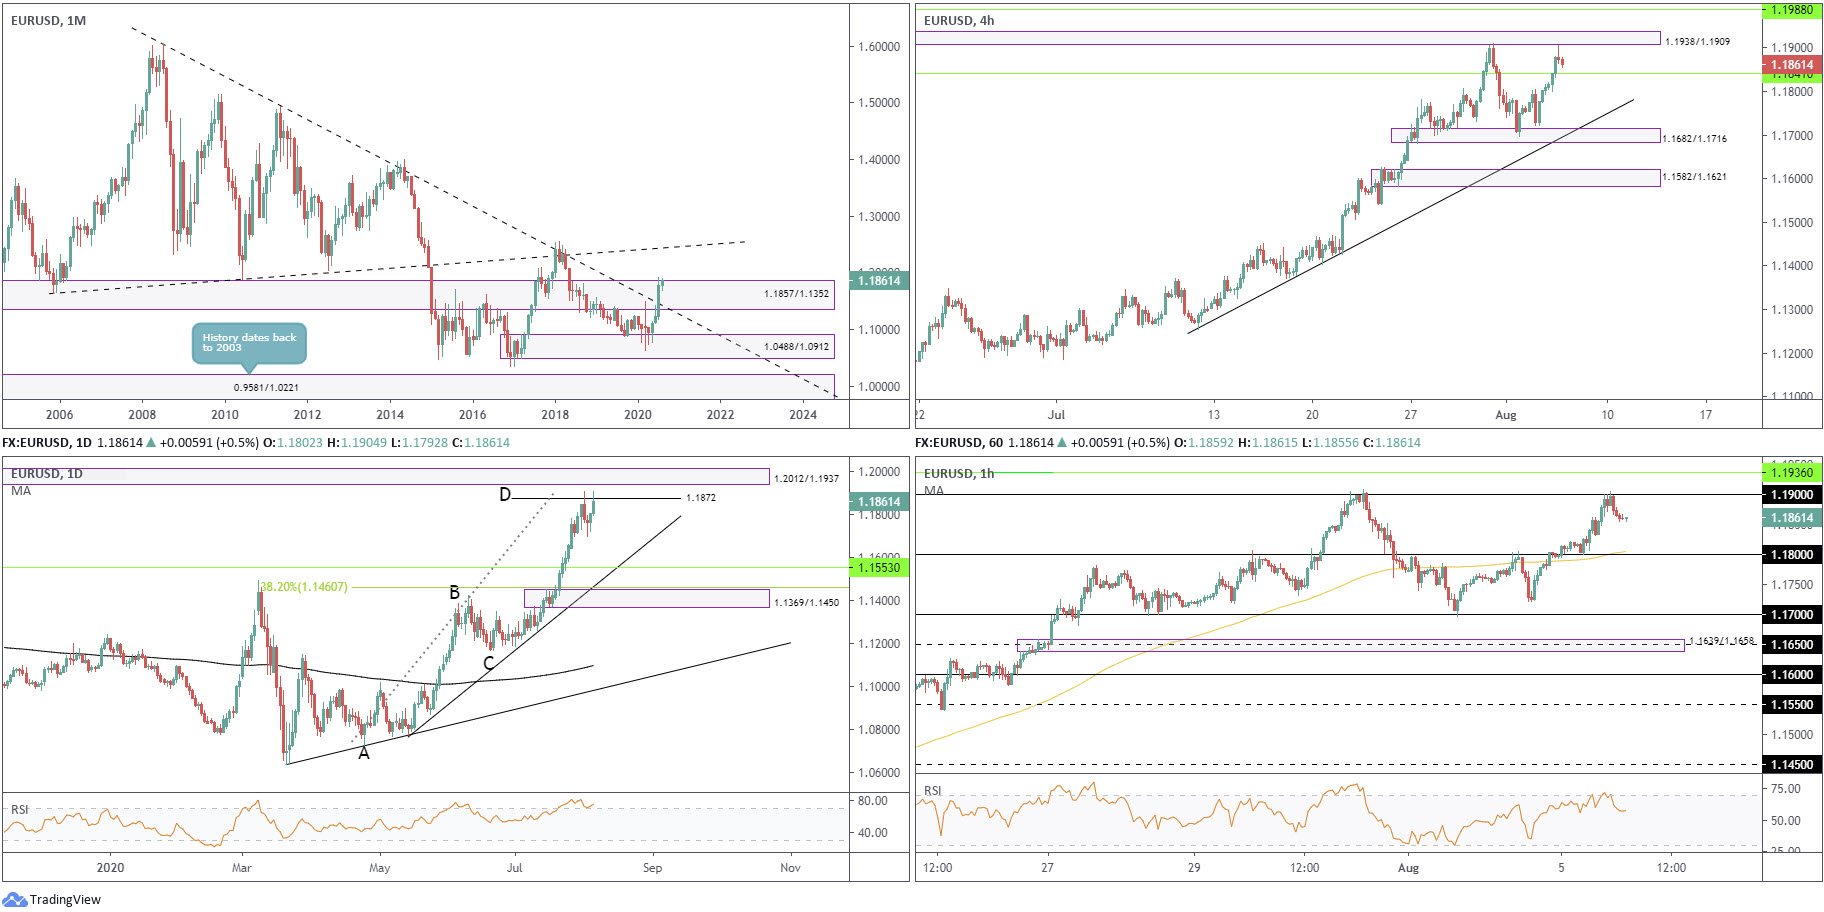
The euro punched out a third successive monthly gain against the US dollar in July, adding nearly 5 percent. The move toppled long-term trendline resistance (1.6038) and made contact with the upper border of supply from 1.1857/1.1352. This argues a trend change to the upside may be on the horizon, with trendline resistance (prior support – 1.1641) on the radar as the next upside target.
Daily timeframe:
Partially altered from previous analysis –
After a fleeting move to lows at 1.1695, EUR/USD recently switched tracks and readdressed the ABCD bearish pattern at 1.1872, situated ahead of supply at 1.2012/1.1937. Logically, with monthly price echoing a one-sided market to the upside this could have 1.1872 cede ground and daily supply call for attention.
Downside, should sellers regain consciousness, has support at 1.1553 on the radar as the initial point of interest. This is, of course, assuming we take Monday’s low at 1.1695.
With respect to the RSI indicator, the value topped around 80.00 last week and remains within overbought terrain heading into Thursday’s action.
H4 timeframe:
Price action on the H4 chart nudged to within touching distance of supply coming in at 1.1938/1.1909 Wednesday, after toppling resistance at 1.1841. The distinct H4 bearish wick seen ahead of the aforesaid supply is a sign of seller intent, underpinning the possibility of a 1.1841 retest in early Asian trading today.
Elbowing under the current support, nonetheless, has trendline support (1.1254) in the firing range.
H1 timeframe:
1.19 re-entered the spotlight on Wednesday, pulling the RSI indicator into overbought space.
Positioned under resistance at 1.1936, the recent 1.19 reaction could direct intraday sellers back towards the 1.18 area, currently sharing space with the 100-period simple moving average.
Structures of Interest:
Partially altered from previous analysis –
The monthly timeframe urges traders to consider the possibility of a long-term trend change after overrunning trendline resistance. Clearing monthly supply at 1.1857/1.1352 would help confirm this. This, along with daily price echoing a bullish tone, could see daily supply at 1.2012/1.1937 move into the light.
H4 is poised to retest support at 1.1841 after nearing supply at 1.1938/1.1909. While 1.1841 could hold, H1 could perhaps spear things towards the 1.18 region before a resurgence of buying comes to life.
AUD/USD:
Monthly timeframe:
(Technical change on this timeframe is often limited though serves as guidance to potential longer-term moves)
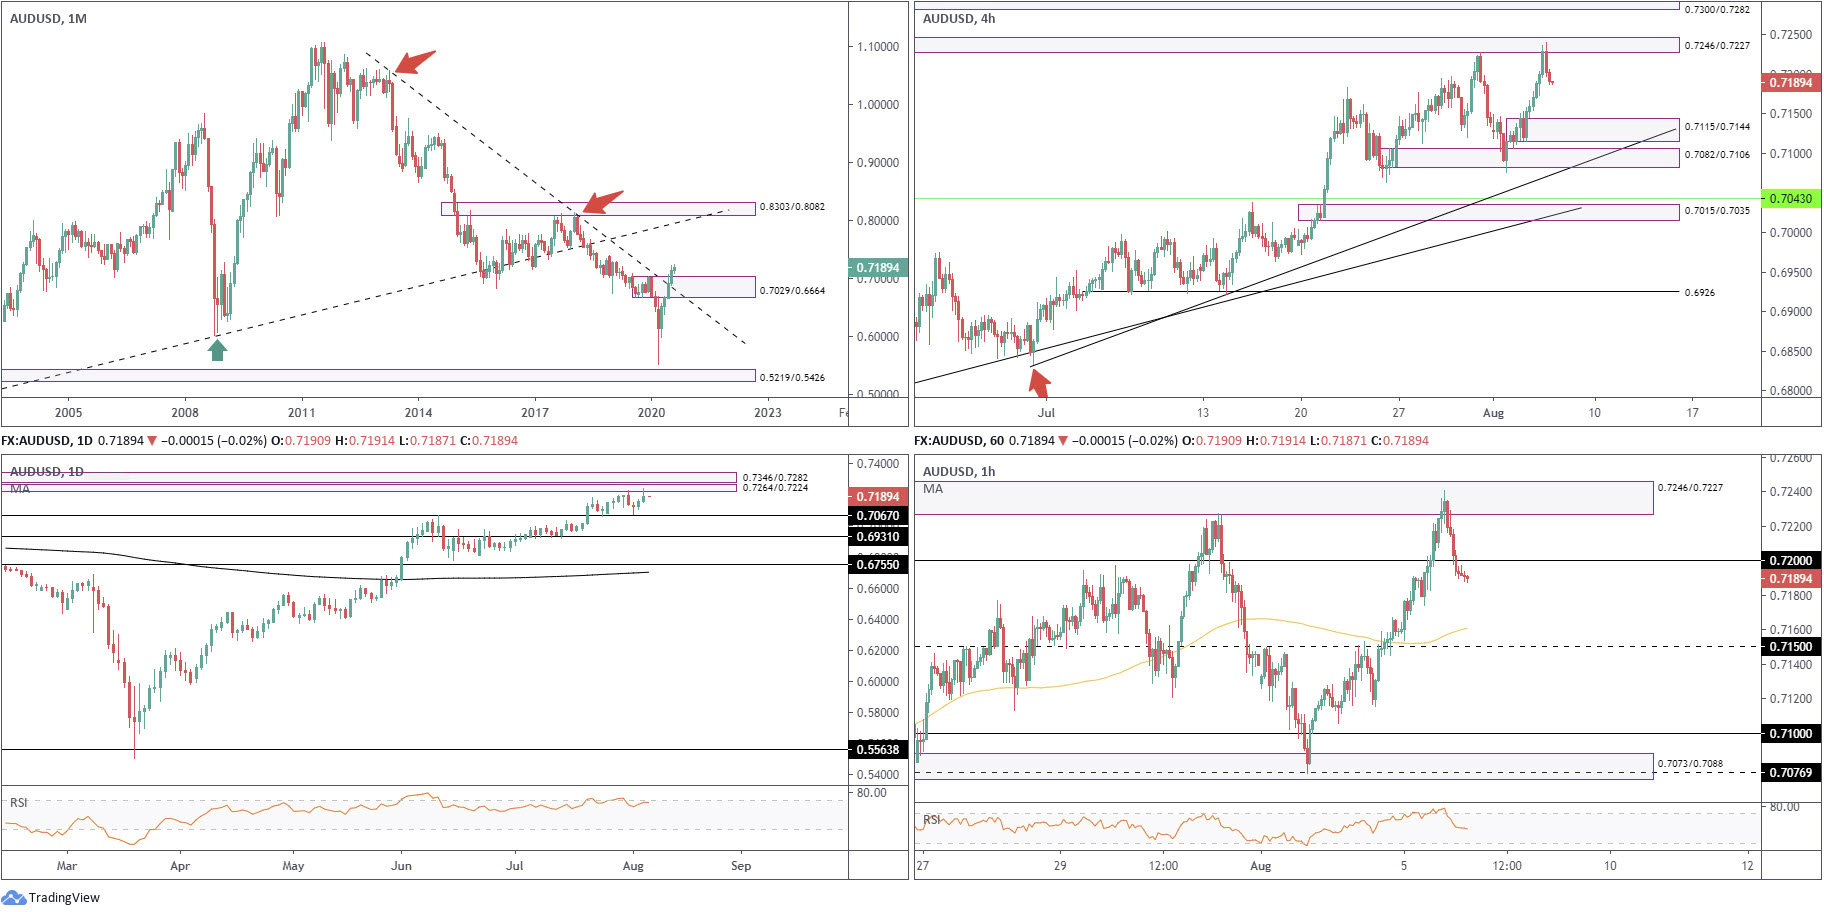
May’s extension, together with June and July’s follow-through, witnessed supply at 0.7029/0.6664 and intersecting long-term trendline resistance (1.0582) relinquish ground. Concluding July higher by 3.5 percent, buyers appear free to explore as far north as 0.8303/0.8082, a supply zone aligning closely with trendline resistance (prior support – 0.4776).
Despite taking trendline resistance, the market’s primary trend still points south, demonstrating a series of lower lows and lower highs since mid-2011.
Daily timeframe:
Partially altered from previous analysis –
The technical picture reveals price holding above support at 0.7067, with yesterday crossing paths with supply at 0.7264/0.7224, stationed underneath another supply at 0.7346/0.7282. The latter is formed by way of a demand-turned supply.
With reference to the RSI indicator, we are fading overbought status but still appear reluctant to break 60.00 to the downside.
H4 timeframe:
AUD/USD ended higher by nearly 0.5% Wednesday, whipsawing through local highs and striking supply at 0.7246/0.7227. The reasonably attractive reaction out of the zone may appeal to countertrend strategies today, signalling possible moves to at least demand coming in from 0.7115/0.7144. Breaking to higher ground today, on the other hand, throws light on supply at 0.7300/0.7282.
H1 timeframe:
Sellers from 0.72 into European trade had a hard time Wednesday, while intraday breakout buyers were given 40 pips to lock in some profits before price turned from nearby supply at 0.7246/0.7227 (H4 supply).
Wednesday concluded back beneath the 0.72 level, shining light on the possibility of an acceleration to 0.7150 support and 100-period simple moving average.
Structures of Interest:
Partially altered from previous analysis –
Monthly price sweeping through supply and associated trendline resistance has likely aroused interest from longer-term traders. Daily price holds support at 0.7067, though is currently capped at supply from 0.7264/0.7224.
On the H4 timeframe, we recently rotated from supply at 0.7246/0.7227. With room on the H4 to approach demand at 0.7115/0.7144, the break under 0.72 on the H1 will likely be interpreted as a bearish cue today in favour of a 0.7150 test.
USD/JPY:
Monthly timeframe:
(Technical change on this timeframe is often limited though serves as guidance to potential longer-term moves)
Since kicking off 2017, USD/JPY has been carving out a descending triangle pattern between 118.66/104.62.
April, May and June were pretty uneventful, with the latter wrapping up indecisively in the shape of a neutral doji candlestick pattern. July, nonetheless, sunk nearly 2 percent, consequently testing the lower boundary of the current descending triangle.
Areas outside of the noted triangle can be seen at supply from 126.10/122.66 and demand coming in at 96.41/100.81.
Daily timeframe:
Brought forward from previous analysis –
Having monthly support at 104.62 make a show, daily price ended the week retesting the underside of 105.70/106.66 as supply, with Monday settling by way of a reasonably attractive shooting star candlestick pattern, considered a bearish signal at peaks. Tuesday and Wednesday had sellers come forward and display interest, yet whether adequate enough to roll 104.62 back into action is difficult to judge.
Removing 105.70/106.66 may have the pair work its way into the next available supply at 107.58/106.85.
H4 timeframe:
Partially altered from previous analysis –
Support at 105.68 had little to offer buyers Wednesday, consequently dropping to the (Andrew’s Pitchfork) median line (108.16) and coming within the immediate vicinity of demand at 105.06/105.30 (prior supply).
Declining to lower levels could swing things back into monthly support at 104.62; yet, a move back above 105.68 has resistance derived from the Andrew’s Pitchfork (107.54) on the radar.
H1 timeframe:
Rallying out of demand at 105.37/105.21 as we transitioned into US trading has so far been shaky, recently connecting with 105.80/105.63 supply after price marginally unwound above 105.50. Traders will note the 100-period simple moving average also resides amongst this structure.
Outside of the aforesaid areas, technical eyes are likely on 105 and 106.
Structures of Interest:
H1 supply at 105.80/105.63 currently caps intraday upside, an area holding H4 resistance within at 105.68. This, as well as daily supply at 105.70/106.66, may excite sellers today. The caveat, however, is monthly price recently staging a comeback from the descending triangle’s lower perimeter at 104.62.

GBP/USD:
Monthly timeframe:
(Technical change on this timeframe is often limited though serves as guidance to potential longer-term moves)
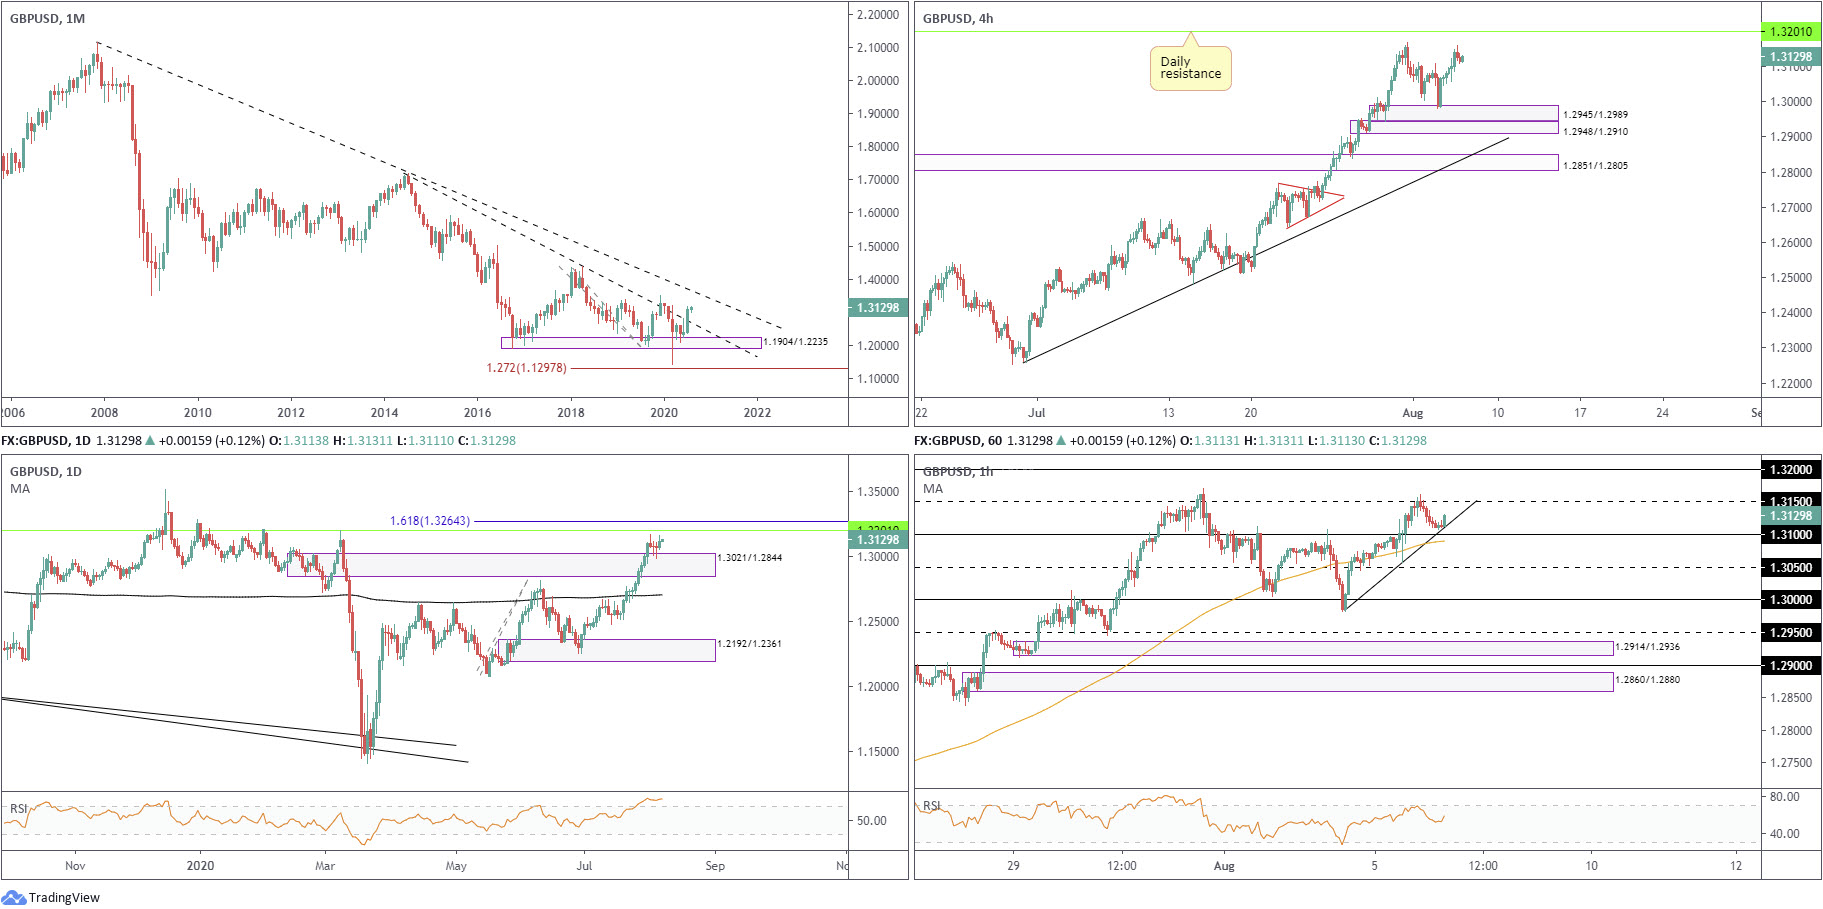
GBP/USD finished higher by 5.5 percent in July, leading to long-term trendline resistance (1.7191) being absorbed. This follows support at 1.1904/1.2235 withstanding downside attempts during April and May.
Despite the primary trend facing lower since early 2008, rupturing current trendline resistance could have buyers work towards another prominent trendline resistance (2.1161) over the coming weeks.
Daily timeframe:
Partially altered from previous analysis –
After squeezing through the 200-day simple moving average and toppling supply at 1.3021/1.2844, price action recently revisited the latter as a demand and fuelled modest upside Wednesday.
Resistance at 1.3201, sited ahead of the 161.8% Fib ext. level at 1.3264, could welcome price movement today in the event we pop higher.
The RSI oscillator, for those who follow momentum indicators, will note the value continues to toy with the 80.00 overbought level.
H4 timeframe:
Following Tuesday’s impressive recovery from demand at 1.2945/1.2989 (part of a stacked demand [1.2948/1.2910]), and Wednesday’s follow-through buying, daily resistance at 1.3201 is now in sight, assuming we take out last Friday’s high at 1.3170.
H1 timeframe:
Drilling down to the H1 chart, price action traders will note we recently faded 1.3150 resistance and retested trendline support (1.2982). This ascending support, as you can see, is set just ahead of the 1.31 level and 100-period simple moving average. Conquering 1.3150 today moves the 1.32 level into the setting, which, as we already know, represents daily resistance parked at 1.3201.
Structures of Interest:
Monthly breaking trendline resistance sends across an optimistic tone for GBP this month. This is further reinforced by the recent retest at daily demand from 1.3021/1.2844, likely enough to fuel a move to daily resistance at 1.3201.
H1 trendline support (1.2982) recently made a show and, for now, is holding. Some intraday traders may feel this to be an adequate entry point long, having seen where we’re positioned on the bigger picture. A H1 close above 1.3150, in this case, is likely to serve as a breakeven trigger.
DISCLAIMER:
The information contained in this material is intended for general advice only. It does not take into account your investment objectives, financial situation or particular needs. FP Markets has made every effort to ensure the accuracy of the information as at the date of publication. FP Markets does not give any warranty or representation as to the material. Examples included in this material are for illustrative purposes only. To the extent permitted by law, FP Markets and its employees shall not be liable for any loss or damage arising in any way (including by way of negligence) from or in connection with any information provided in or omitted from this material. Features of the FP Markets products including applicable fees and charges are outlined in the Product Disclosure Statements available from FP Markets website, www.fpmarkets.com and should be considered before deciding to deal in those products. Derivatives can be risky; losses can exceed your initial payment. FP Markets recommends that you seek independent advice. First Prudential Markets Pty Ltd trading as FP Markets ABN 16 112 600 281, Australian Financial Services License Number 286354.


 Access +10,000 financial
instruments
Access +10,000 financial
instruments