
EUR/USD:
Monthly timeframe:
(Technical change on this timeframe is often limited though serves as guidance to potential longer-term moves)
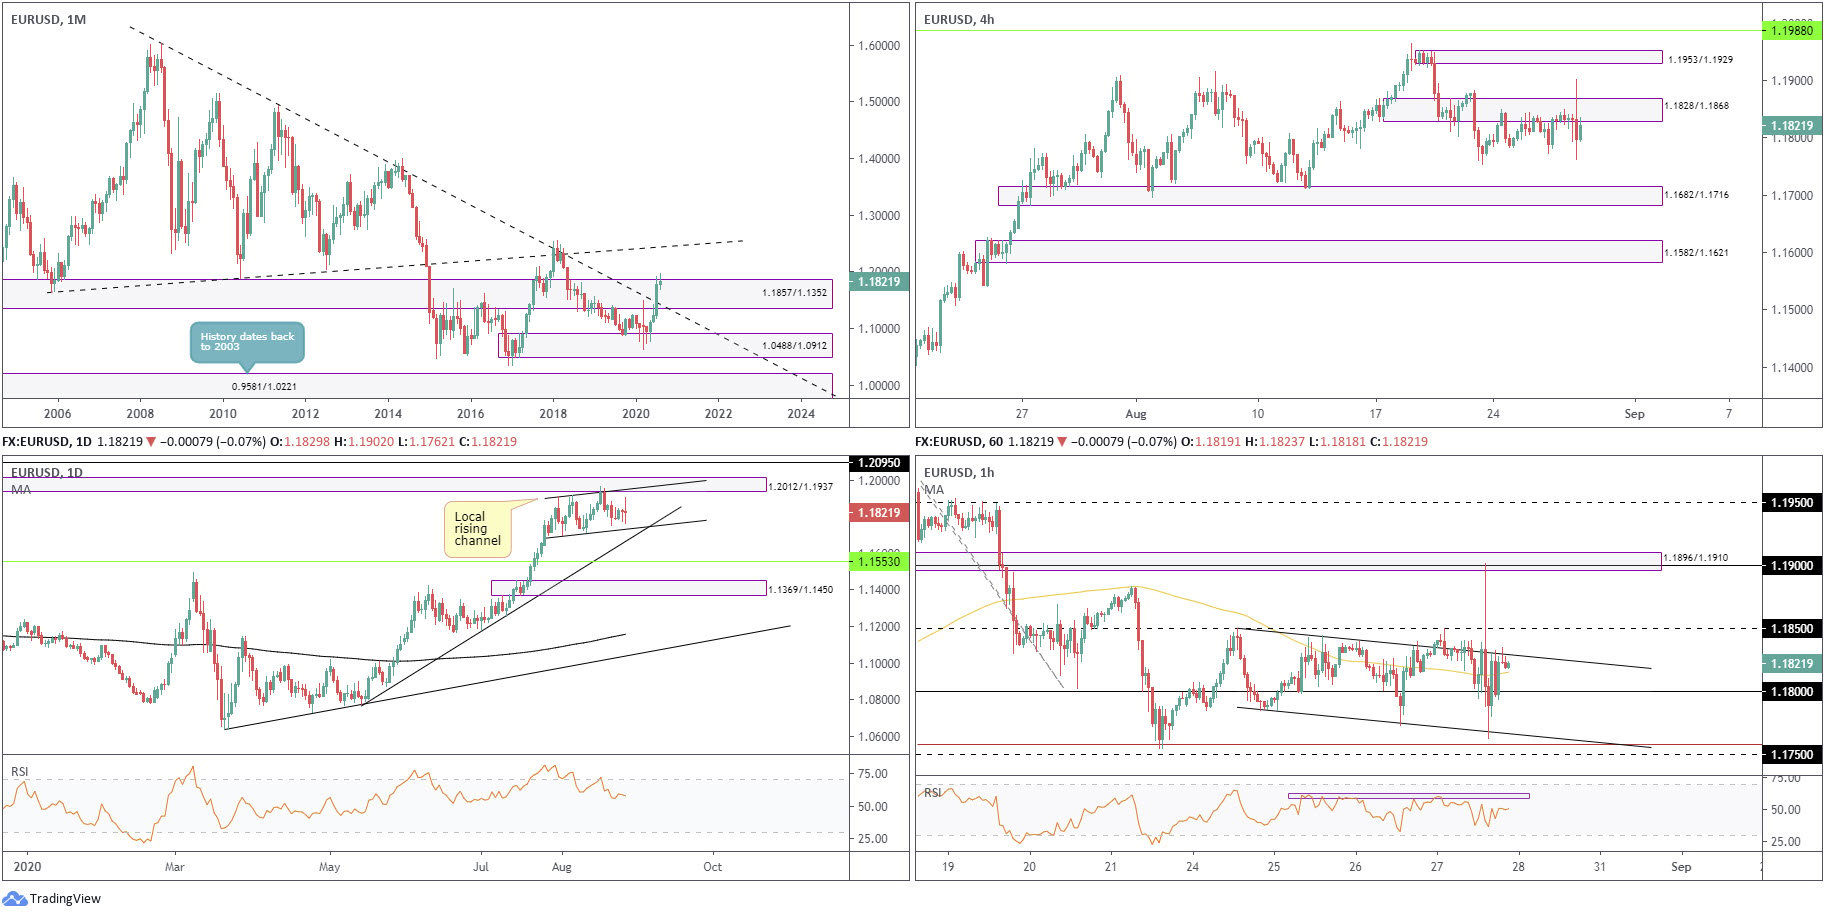
The euro nudged to a third successive monthly gain against the US dollar in July, adding nearly 5 percent. The move toppled long-term trendline resistance (1.6038) and made contact with the upper border of supply from 1.1857/1.1352.
This argues a move to the upside may be on the horizon, with trendline resistance (prior support – 1.1641) on the radar as the next target. Also worth noting, though, is the primary downtrend (since July 2008) remains intact until 1.2555 is engulfed (Feb 1 high [2018]).
August, as you can see, has been relatively lacklustre, currently up by only 0.4 percent.
Daily timeframe:
Partially altered from previous analysis –
Efforts to extend July’s advance have so far been contained within a rising channel pattern (1.1695/1.1909), in addition to supply at 1.2012/1.1937 also recently making an entrance, extended from May 2018. Trendline support (1.0774) is likely to accept price should a break lower come to pass, while immersing the aforesaid supply favours moves to resistance at 1.2095.
Candlestick traders will note yesterday’s action concluded by way of a long-legged doji candlestick formation, indicating indecision.
The RSI indicator, since the beginning of August, has drifted lower and exited overbought space, currently circling the 60.00 neighbourhood.
H4 timeframe:
Partially altered from previous analysis –
Supply at 1.1828/1.1868, albeit stomaching a decisive spike to highs at 1.1901, remains in motion. Should sellers regain consciousness, demand at 1.1682/1.1716 is visible, while an extension to the upside, moves that topple current supply, tips price for more outperformance to another supply coming in from 1.1953/1.1929.
H1 timeframe:
Markets observed choppy price action on Thursday amid the Fed’s Framework review announcement. EUR/USD spiked to peaks north of 1.19, a level enclosed within supply at 1.1896/1.1910. As you can see, though, the H1 timeframe’s descending channel (1.1849/1.1784) remained intact, which houses 1.18 within and the 100-period simple moving average.
Outside of the channel, crosshairs are likely fixed on the 127.2% Fib ext. at 1.1757 and 1.1750 support, while to the upside 1.1850 resistance can be seen.
Structures of Interest:
Based on recent action, the market appears to be gearing up for a move higher. Aside from the monthly timeframe threatening further buying above supply at 1.1857/1.1352, and room to manoeuvre higher on the daily timeframe until supply at 1.2012/1.1937, traders will note H4 supply at 1.1828/1.1868 echoes a fragile tone.
The above suggests H1 candles may dethrone channel resistance and 1.1850 resistance today, in favour of an approach to the 1.19 neighbourhood.
AUD/USD:
Monthly timeframe:
(Technical change on this timeframe is often limited though serves as guidance to potential longer-term moves)
May’s extension, together with June and July’s follow-through, witnessed supply at 0.7029/0.6664 and intersecting long-term trendline resistance (1.0582) abandon its position.
Concluding July higher by 3.5 percent, buyers appear free to explore as far north as 0.8303/0.8082 in the coming months, a supply zone aligning closely with trendline resistance (prior support – 0.4776).
Although price has removed trendline resistance, the market’s primary trend (since mid-2011) remains south until breaking 0.8135 (January high [2018]).
Daily timeframe:
Partially altered from previous analysis –
Since mid-June, the pair has been compressing north between two converging trendlines (0.6832/0.7064), in what appears to be a rising wedge. Price has been trending higher since March on the daily timeframe, though, as already stated on the monthly chart, the primary trend faces southbound.
Over the past three days, AUD/USD forged daily gains which led to price re-joining supply at 0.7346/0.7282. A break below the rising wedge, nonetheless, may have dips find initial support around the 0.7067 region.
H4 timeframe:
Resistance at 0.7237 put up little fight Thursday, with the pair ultimately drawing in supply at 0.7300/0.7282. Interestingly, 0.7237 now currently serves as support.
It may also interest traders to note the current H4 supply is fastened to the underside of daily supply at 0.7346/0.7282.
H1 timeframe:
Demand at 0.7236/0.7222 (prior supply) played a key role on the charts Thursday, withstanding a number of downside attempts. Also noticeable is the rising channel that currently envelopes price movement from 0.7150/0.7207.
The pair ended Thursday exploring territory north of 0.7250. Given yesterday’s spike to highs at 0.7290, a move that possibly cleared sellers, additional bullish sentiment could be at hand today, taking aim at 0.73.
Structures of Interest:
In essence, we’re currently working with the following:
- Monthly action suggests higher moves after taking supply, though the primary trend is still down.
- Daily testing supply; price is contained within a rising wedge and the trend faces north on this timeframe.
- H4 supply boasts a connection to daily supply. We also have H4 support in view.
- H1 demonstrates upside north of 0.7250.
Monthly and the H1 timeframes trade in harmony, therefore moves north of 0.7250 are a possibility to 0.73 today.
Daily and H4 timeframes, on the other hand, test supply and pose a problem for buyers.

DISCLAIMER:
The information contained in this material is intended for general advice only. It does not take into account your investment objectives, financial situation or particular needs. FP Markets has made every effort to ensure the accuracy of the information as at the date of publication. FP Markets does not give any warranty or representation as to the material. Examples included in this material are for illustrative purposes only. To the extent permitted by law, FP Markets and its employees shall not be liable for any loss or damage arising in any way (including by way of negligence) from or in connection with any information provided in or omitted from this material. Features of the FP Markets products including applicable fees and charges are outlined in the Product Disclosure Statements available from FP Markets website, www.fpmarkets.com and should be considered before deciding to deal in those products. Derivatives can be risky; losses can exceed your initial payment. FP Markets recommends that you seek independent advice. First Prudential Markets Pty Ltd trading as FP Markets ABN 16 112 600 281, Australian Financial Services License Number 286354.


 Access +10,000 financial
instruments
Access +10,000 financial
instruments