
EUR/USD:
Monthly timeframe:
(Technical change on this timeframe is often limited though serves as guidance to potential longer-term moves)
The euro punched out a third successive monthly gain against the US dollar in July, adding nearly 5 percent. The move toppled long-term trendline resistance (1.6038) and made contact with the upper border of supply from 1.1857/1.1352. This argues a trend change to the upside may be on the horizon, with trendline resistance (prior support – 1.1641) on the radar as the next upside target.
August, as you can see, currently trades cautiously, up by 0.30 percent.
Also worth pointing out, though, is the primary trend remains intact, underlining a southerly course since July 2008.
Daily timeframe:
Since closing out the month of July, buyers and sellers have been squaring off at the underside of an ABCD bearish pattern at 1.1872, a simple harmonic configuration. Should buyers lose their flavour here, and we swarm 1.1695, support at 1.1553 swings into view as the next point of interest (along with trendline support [1.0774]). In the event offers dry up, however, supply at 1.2012/1.1937 is positioned close by.
In reference to the RSI indicator, recent action departed overbought territory, yet appears reluctant to commit to the downside.
H4 timeframe:
Bullish forces remained in play Thursday as the US dollar index pencilled in a fleeting move under the 93.00 level. Extending gains above demand at 1.1682/1.1716, the pair strengthened to resistance at 1.1841 and fashioned a bearish outside reversal candle.
Supply at 1.1938/1.1909 has so far played an important role during August (glued to the underside of daily supply at 1.2012/1.1937), and could make a show if current resistance gives way.
Technicians will also note, thanks to Wednesday’s retest at demand from 1.1682/1.1716, the H4 timeframe is now considered rangebound between the aforesaid demand and supply at 1.1938/1.1909.
H1 timeframe:
US traders engaged local resistance at 1.1863, following an advance during Asia and the European morning session, moves that brushed aside the 1.18 level in reasonably dominant fashion.
Bearish forces from 1.1863 shifted 1.18 back into the frame, a barrier currently defended as support. South of the latter, the 100-period simple moving average is visible around 1.1776, with a break unmasking support at 1.1724.
In terms of the RSI value, the indicator, after fading overbought status, tested the 50.00 mid-point base yesterday and modestly curved higher.
Structures of Interest:
Daily ABCD resistance at 1.1872, H4 resistance at 1.1841 and H1 resistance at 1.1863 may pressure bids off 1.18 and send H1 candles to the 100-period simple moving average at 1.1776 today. Conversely, there is also the possibility buyers have taken cues from the monthly timeframe piercing supply at 1.1857/1.1352, which could reinforce bids off 1.18.
Targets above 1.18 are set at the aforesaid resistances, while through the 100-period simple moving average, H1 support at 1.1724 represents a logical target for bearish strategies.

AUD/USD:
Monthly timeframe:
(Technical change on this timeframe is often limited though serves as guidance to potential longer-term moves)
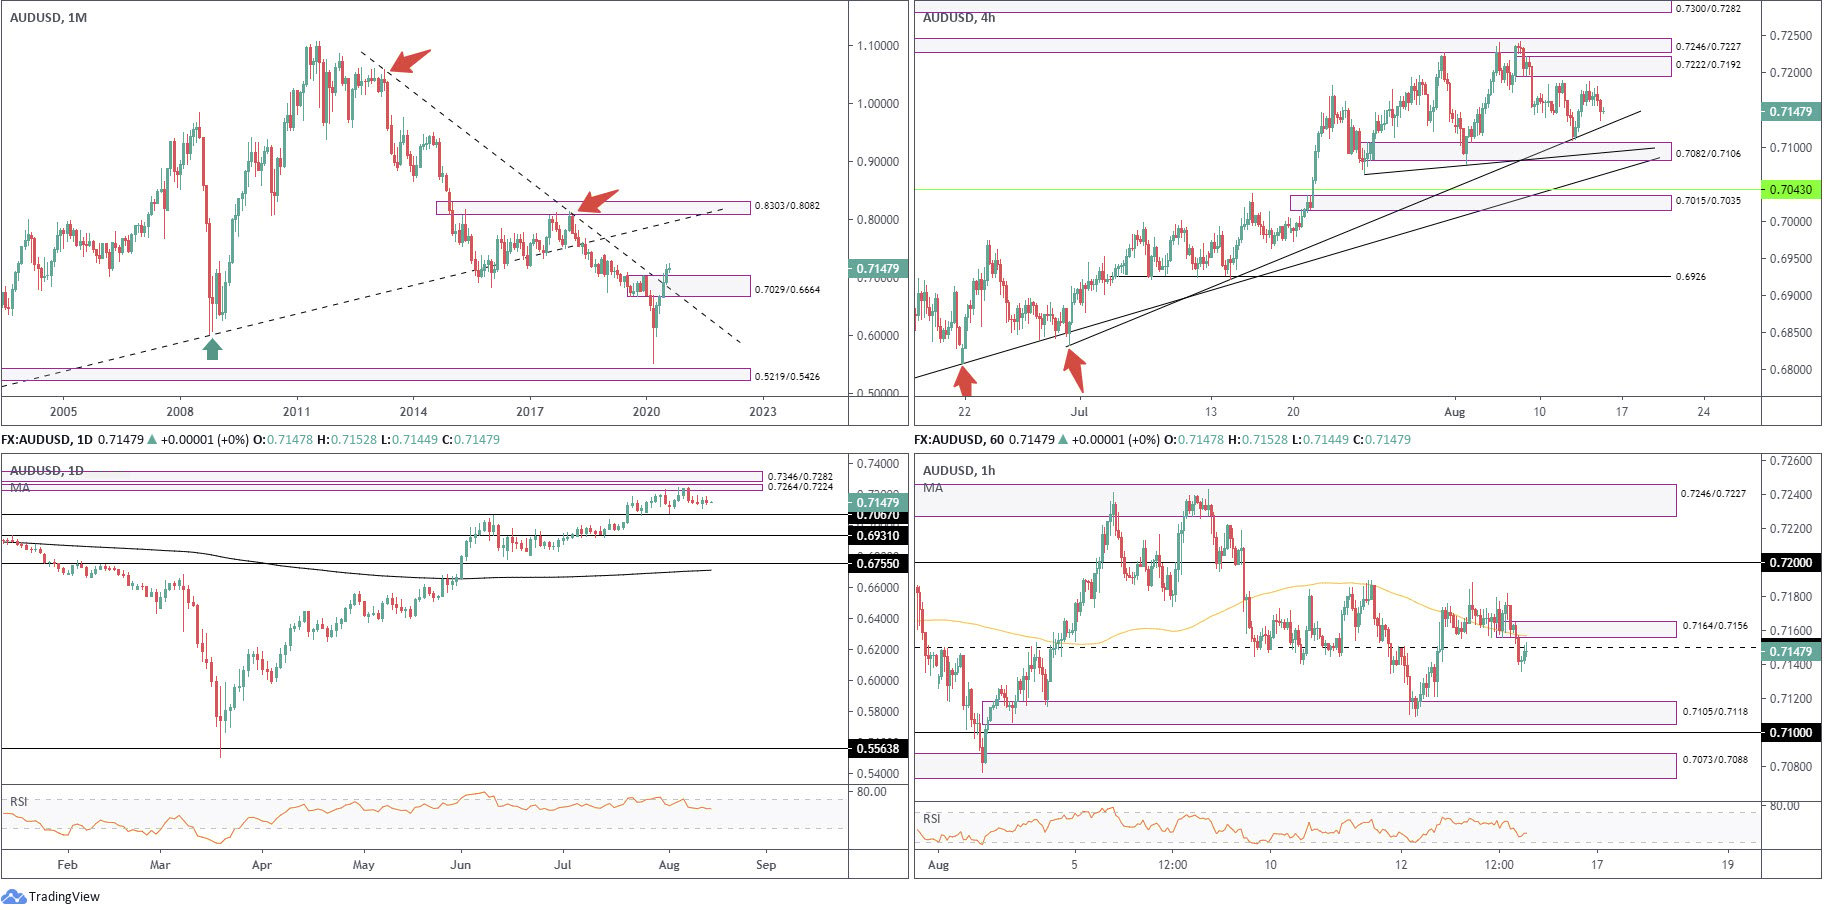
May’s extension, together with June and July’s follow-through, witnessed supply at 0.7029/0.6664 and intersecting long-term trendline resistance (1.0582) relinquish ground. Concluding July higher by 3.5 percent, buyers appear free to explore as far north as 0.8303/0.8082 in August, a supply zone aligning closely with trendline resistance (prior support – 0.4776).
Despite recently taking trendline resistance, the market’s primary trend still points south, demonstrating a series of lower lows and lower highs since mid-2011.
Daily timeframe:
Despite last Friday’s bearish outside day reversal from supply at 0.7264/0.7224 (stationed underneath another supply at 0.7346/0.7282), price action has remained pretty much stationary this week. In terms of support on this timeframe, we have 0.7067 in sight.
With reference to the RSI indicator, the value has been toying with overbought levels since July 20.
H4 timeframe:
Brought forward from previous analysis –
Trendline support (0.6832) was brought to light Wednesday, underpinning price movement ahead of demand at 0.7082/0.7106. Traders will note the aforesaid demand also carries a local trendline support (0.7063). A break of current demand also shines light on another trendline support (0.6776).
Supply at 0.7222/0.7192 also rests relatively close by, shadowed by another supply at 0.7246/0.7227.
H1 timeframe:
After spending the majority of Thursday attempting to fashion support off the 100-period simple moving average, buyers eventually stepped aside. 0.7150 support gave way, a level, which as of current price, is being retested as resistance. Failure to hold could lead H1 candles to newly formed supply at 0.7164/0.7156, a particularly interesting area as it was within this zone a decision was made to push through 0.7150, indicating strong sellers perhaps shaped this base.
Demand at 0.7105/0.7118, an area initially overlooked in favour of 0.71 support, offers a well-grounded platform to target from 0.7150 today.
Structures of Interest:
Partially altered from previous analysis –
Monthly price sweeping through supply and associated trendline resistance has likely aroused interest from longer-term buyers. Daily price, however, is considered relatively inactive between nearby areas.
H1 currently retests 0.7150 resistance (reinforced closely by supply at 0.7164/0.7156), movement that could trigger a wave of selling towards at least H1 demand at 0.7105/0.7118, positioned just under H4 trendline support (0.6832).
USD/JPY:
Monthly timeframe:
(Technical change on this timeframe is often limited though serves as guidance to potential longer-term moves)
Since kicking off 2017, USD/JPY has been carving out a descending triangle pattern between 118.66/104.62.
April, May and June were pretty uneventful, with the latter wrapping up indecisively in the shape of a neutral doji candlestick pattern. July, nonetheless, sunk nearly 2 percent, consequently testing the lower boundary of the descending triangle. August currently trades higher by 1 percent.
Areas outside of the noted triangle can be seen at supply from 126.10/122.66 and demand coming in at 96.41/100.81.
Daily timeframe:
Brought forward from previous analysis –
Having monthly support at 104.62 make a show, daily price recently made contact with supply at 107.58/106.85.
Bulls remain in charge right now and, assuming a violation of current supply, could see buyers pursue resistance formed by way of the 200-day simple moving average at around 108.11.
The RSI value recently gave up its 50.00 line to the upside.
H4 timeframe:
Partially altered from previous analysis –
Strengthened by trendline support (prior resistance – 108.16), demand at 106.39/106.64 (prior supply) provided buyers a platform in which to reach higher levels Thursday.
This throws light on two areas of supply today at 107.37/107.17 and 107.60/107.42, with the latter sharing its upper border with a possible ABCD bearish correction at 107.58.
H1 timeframe:
Since Wednesday, H1 action has been carving out a consolidation between the 107 level and 106.70 support.
Demand from 106.49/106.35 (prior supply), trendline support (105.30) and the 100-period simple moving average inhabit territory under 106.70, in case we seek deeper water. Bumping above 107, on the other hand, will likely see buyers work their way towards supply at 107.31/107.20.
Structures of Interest:
Coming off monthly support at 104.62, daily action now tests the mettle of supply coming in at 107.58/106.85. Notably, both H4 supply areas at 107.60/107.42 and 107.37/107.17 have a connection with the upper boundary of the aforesaid daily supply. Additionally, H1 supply at 107.31-107.20 inhabits H4 supply at 107.37/107.17.
With considerable supply in play on the daily timeframe and nearby supply positioned on the H4 and H1 timeframes, upside momentum may diminish and provide countertrend traders an entry into the market. Harmonic traders will particularly favour the H4 ABCD correction at 107.58.
On account of the above, a price range between 107.60/107 could house active sellers.

GBP/USD:
Monthly timeframe:
(Technical change on this timeframe is often limited though serves as guidance to potential longer-term moves)
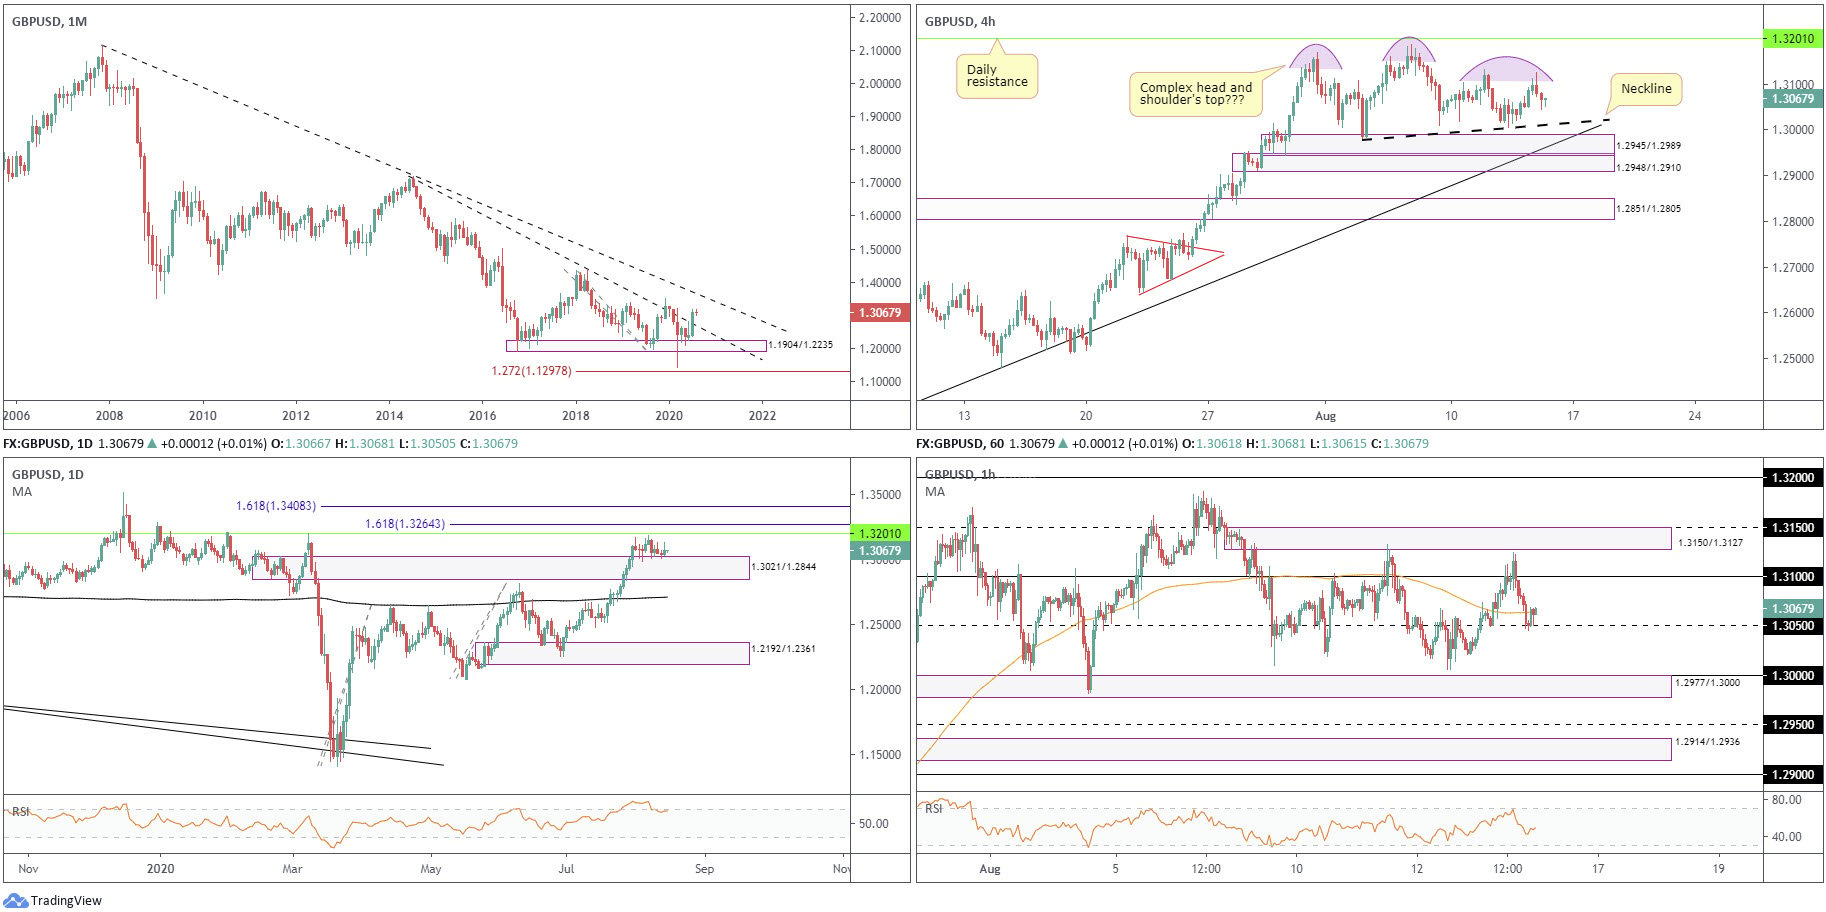
GBP/USD finished higher by 5.5 percent in July, leading to long-term trendline resistance (1.7191) abandoning its position.
Despite the primary trend facing lower since early 2008, the break of current trendline resistance could have buyers work towards another prominent trendline resistance (2.1161) over the coming weeks.
August has so far offered little movement, trading lower by 0.1% as of current price.
Daily timeframe:
Brought forward from previous analysis –
After squeezing through the 200-day simple moving average (July 21), currently fluctuating around 1.2709, and toppling supply at 1.3021/1.2844, price action recently revisited the latter as a demand. So far this week, as you can see, the action has been somewhat muted.
To the upside, resistance at 1.3201 is seen as the next point of interest, located south of a 161.8% Fib ext. level at 1.3264.
The RSI oscillator, for those following momentum indicators, will note the value marginally exited overbought status, recently fading values as far north as 80.00.
H4 timeframe:
Partially altered from previous analysis –
Although concluding higher Thursday, we finished the session considerably off best levels. Forming an intraday peak at 1.3124, a complex head and shoulder’s top pattern could be seen (purple – 1.3170/1.3185/1.3132-1.3124) should sellers remain in the driving seat. The neckline is drawn from 1.2981.
Technical structure, nonetheless, reveals demand at 1.2945/1.2989 is seen nearby, formed as part of a stacked demand at 1.2948/1.2910. Also particularly noteworthy on this timeframe is the aligning trendline support (1.2259).
H1 timeframe:
Partially altered from previous analysis –
We’ve noted a number of whipsaws through 1.31 over the past few weeks, with supply resting close by at 1.3150/1.3127. Yesterday’s whipsaw topped just ahead of current supply, retreating to 1.3050 support and the nearby 100-period simple moving average.
Dropping through 1.3050 shifts attention to the widely watched 1.30 level, reinforced by demand coming in from 1.2977/1.3000. This demand is considered significant on this timeframe, due to it representing an area where a decision was made to break above 1.30.
Structures of Interest:
Partially altered from previous analysis –
Monthly breaking trendline resistance emphasises an optimistic tone for GBP. Daily price, on the other hand, reveals buyers are lacking at demand from 1.3021/1.2844 (prior supply).
A potential H4 complex head and shoulder’s top pattern is worth keeping an eye on, though after breaking the neckline sellers will face considerable H4 (and daily – see above) demand.
H4 demand at 1.2945/1.2989 is also likely watched by many traders, along with connecting H4 demand at 1.2948/1.2910. Noting the 1.30 figure on the H1 inhabits territory just above H4 demand at 1.2945/1.2989 could see a whipsaw through the round number into the aforesaid demand (as well as H1 demand at 1.2977/1.3000). This, assuming a H1 close back above 1.30, may appeal to intraday buyers. Conversely, this will place buyers against any downside pressure derived from the H4 (complex) head and shoulder’s neckline break.
DISCLAIMER:
The information contained in this material is intended for general advice only. It does not take into account your investment objectives, financial situation or particular needs. FP Markets has made every effort to ensure the accuracy of the information as at the date of publication. FP Markets does not give any warranty or representation as to the material. Examples included in this material are for illustrative purposes only. To the extent permitted by law, FP Markets and its employees shall not be liable for any loss or damage arising in any way (including by way of negligence) from or in connection with any information provided in or omitted from this material. Features of the FP Markets products including applicable fees and charges are outlined in the Product Disclosure Statements available from FP Markets website, www.fpmarkets.com and should be considered before deciding to deal in those products. Derivatives can be risky; losses can exceed your initial payment. FP Markets recommends that you seek independent advice. First Prudential Markets Pty Ltd trading as FP Markets ABN 16 112 600 281, Australian Financial Services License Number 286354.


 Access +10,000 financial
instruments
Access +10,000 financial
instruments