
EUR/USD:
Monthly timeframe:
(Technical change on this timeframe is often limited though serves as guidance to potential longer-term moves)
The euro punched out a third successive monthly gain against the US dollar in July, adding nearly 5 percent. The move toppled long-term trendline resistance (1.6038) and made contact with the upper border of supply from 1.1857/1.1352. This argues a trend change to the upside may be on the horizon, with trendline resistance (prior support – 1.1641) on the radar as the next upside target.
August, as you can see, currently trades cautiously, up by 0.10 percent.
Also worth pointing out, though, is the primary trend remains intact, underlining a southerly course since July 2008.
Daily timeframe:
Partially altered from previous analysis –
The ABCD bearish pattern at 1.1872, a simple harmonic configuration, is proving a tough nut to crack since the level made a show at the end of July. Placed just ahead of supply at 1.2012/1.1937, last Friday’s action delivered a muscular bearish candle, a move which snapped a three-day winning streak, with Monday and Tuesday marginally following through to the downside. However, Wednesday, bolstered by the DXY exploring lower terrain, witnessed a rebirth of EUR/USD bidding.
In case buyers lose their flavor, and we take last Monday’s low at 1.1695, support at 1.1553 will firmly be on the radar as the next point of interest.
In reference to the RSI indicator, recent action departed overbought territory though appears reluctant to commit to the downside.
H4 timeframe:
Supply at 1.1938/1.1909 has so far played an important role during August (glued to the underside of daily supply at 1.2012/1.1937), providing enough fuel for price to dethrone support at 1.1841 and carry the action to demand at 1.1682/1.1716, an area which entered play yesterday. This could enforce a retest at 1.1841 resistance.
Also interesting on this time-frame is the recent formation of a potential double-top pattern around the lower ledge of current supply, with a neckline located at 1.1696. Unseating the aforesaid demand (and neckline) positions demand at 1.1582/1.1621 in sight, followed by the double-top take-profit target at 1.1487 (yellow).
H1 timeframe:
Since the beginning of the week, H1 has been entrenched within a ranging motion between support at 1.1724 and the 1.18 handle, a level recently joined by the 100-period simple moving average.
Beyond this range, traders will be watching support by way of the 1.17 handle and a demand area seen at 1.1639/1.1658 (houses 1.1650 support within). Higher up on the curve, 1.19 is tipped to make an entrance should we navigate north of trend line resistance (prior support – 1.1695).
In terms of the RSI value, the indicator recently topped ahead of overbought status, mildly pulling back to the 60.00 neighborhood.
Structures of Interest:
Monthly price has August trading hesitantly around the upper edge of supply at 1.1857/1.1352, while daily sellers appear to be losing steam under the ABCD bearish pattern at 1.1872.
Demand at 1.1682/1.1716 on the H4, as you can see, stood its ground yesterday (holds the H4 double-top pattern neckline within). H1, meanwhile, is pivoting lower off 1.18.
Buyers will likely show interest following a decisive H1 close above 1.18, with room for buyers to stretch to at least H4 resistance at 1.1841. Yet, retreating back into the H1 range off 1.18 today could also stir intraday sellers,targeting 1.1724/1.17.

AUD/USD:
Monthly timeframe:
(Technical change on this timeframe is often limited though serves as guidance to potential longer-term moves)
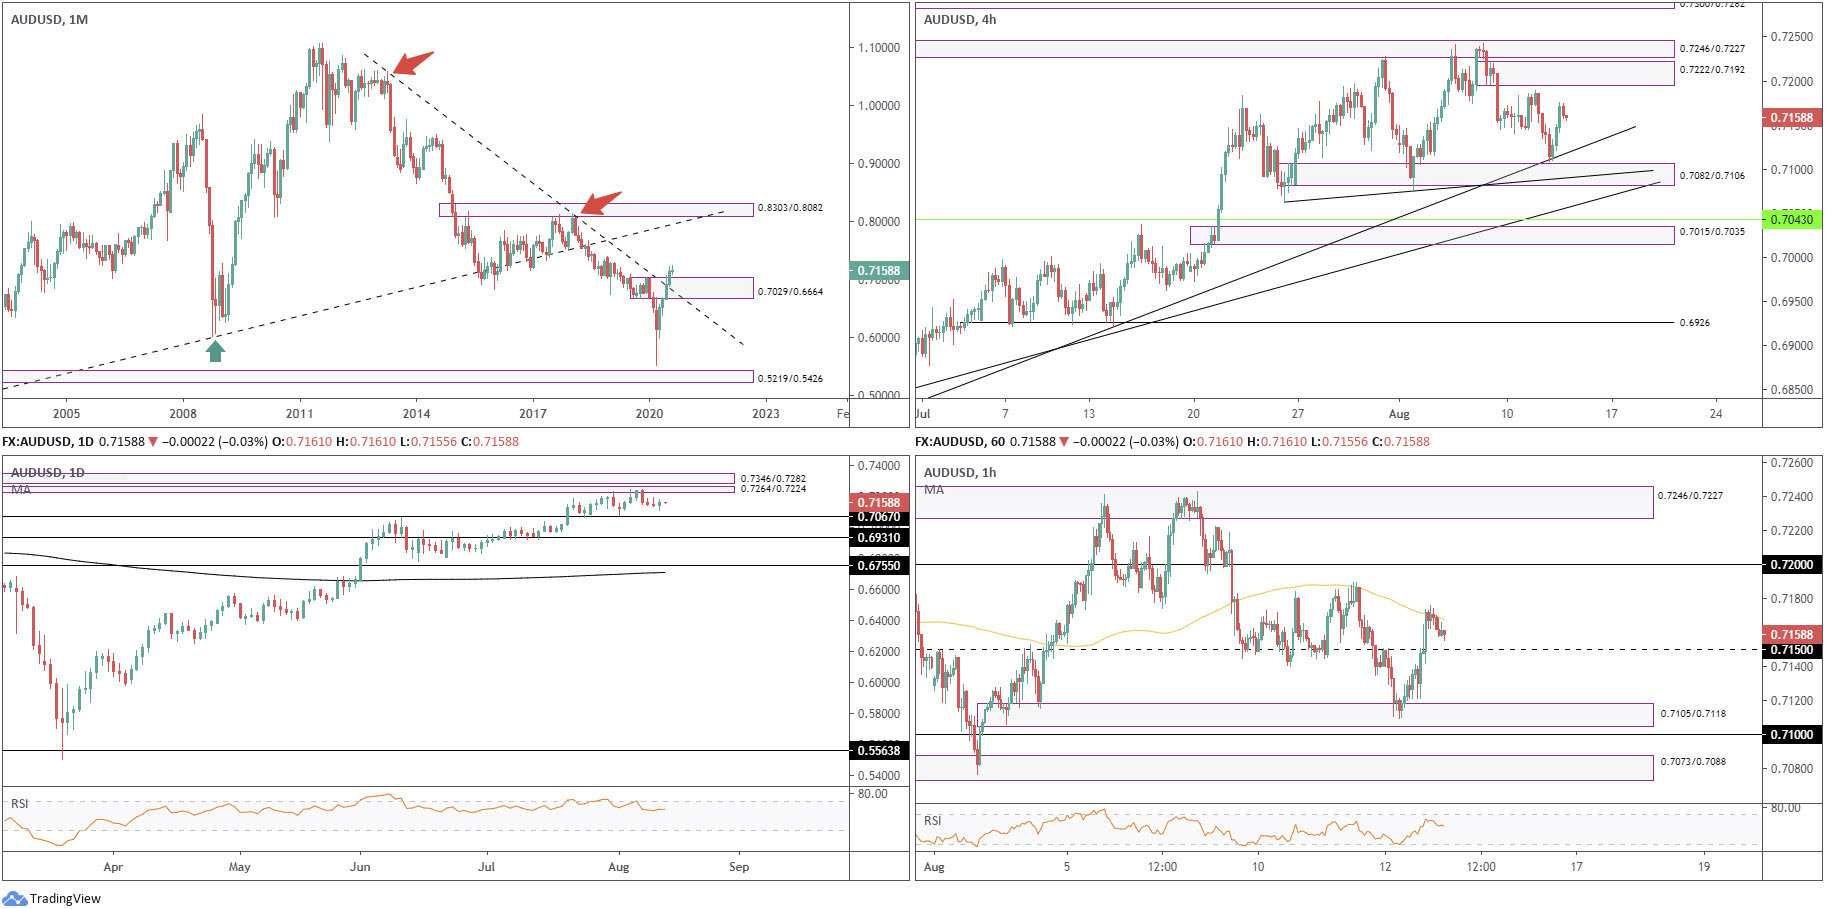
May’s extension, together with June and July’s follow-through, witnessed supply at 0.7029/0.6664 and intersecting long-term trendline resistance (1.0582) relinquish ground. Concluding July higher by 3.5 percent, buyers appear free to explore as far north as 0.8303/0.8082 in August, a supply zone aligning closely with trendline resistance (prior support – 0.4776).
Despite recently taking trendline resistance, the market’s primary trend still points south, demonstrating a series of lower lows and lower highs since mid-2011.
Daily timeframe:
Though buyers stamped in a mild comeback Wednesday, prior highs remained intact.
Ultimately, buyers and sellers continue to square off in between supply at 0.7264/0.7224 (stationed underneath another supply at 0.7346/0.7282) and support from 0.7067.
With reference to the RSI indicator, we have been toying with overbought status since July 20, with the value recently nudging back beneath 60.00.
H4 timeframe:
Trendline support (0.6832) was brought to light Wednesday, underpinning price movement ahead of demand at 0.7082/0.7106. Traders will note the aforesaid demand also carries a local trendline support (0.7063).
A break of current demand shines light on another trendline support (0.6776).
Supply at 0.7222/0.7192 also rests relatively close by, shadowed by another supply at 0.7246/0.7227.
H1 timeframe:
Demand at 0.7105/0.7118, an area initially overlooked in favour of 0.71 support, held in early trading Wednesday,sending price action above 0.7150 resistance to the 100-period simple moving average, currently circling around the 0.7167ish region.
A 0.7150 retest, therefore, is in the offing today, with Tuesday’s peaks at 0.7189 calling for attention, as well as the 0.72 level.
Structures of Interest:
Monthly price sweeping through supply and associated trendline resistance has likely aroused interest from longer-term buyers. Daily price, however, is considered relatively inactive between nearby areas.
H4 exhibits scope to reach for supply at 0.7222/0.7192 and H1 shows a retest at 0.7150 support could be seen. Should the latter come to fruition, in view of H4, daily and monthly timeframes showing room to nudge higher, dip-buyers are likely to make a show.
USD/JPY:
Monthly timeframe:
(Technical change on this timeframe is often limited though serves as guidance to potential longer-term moves)
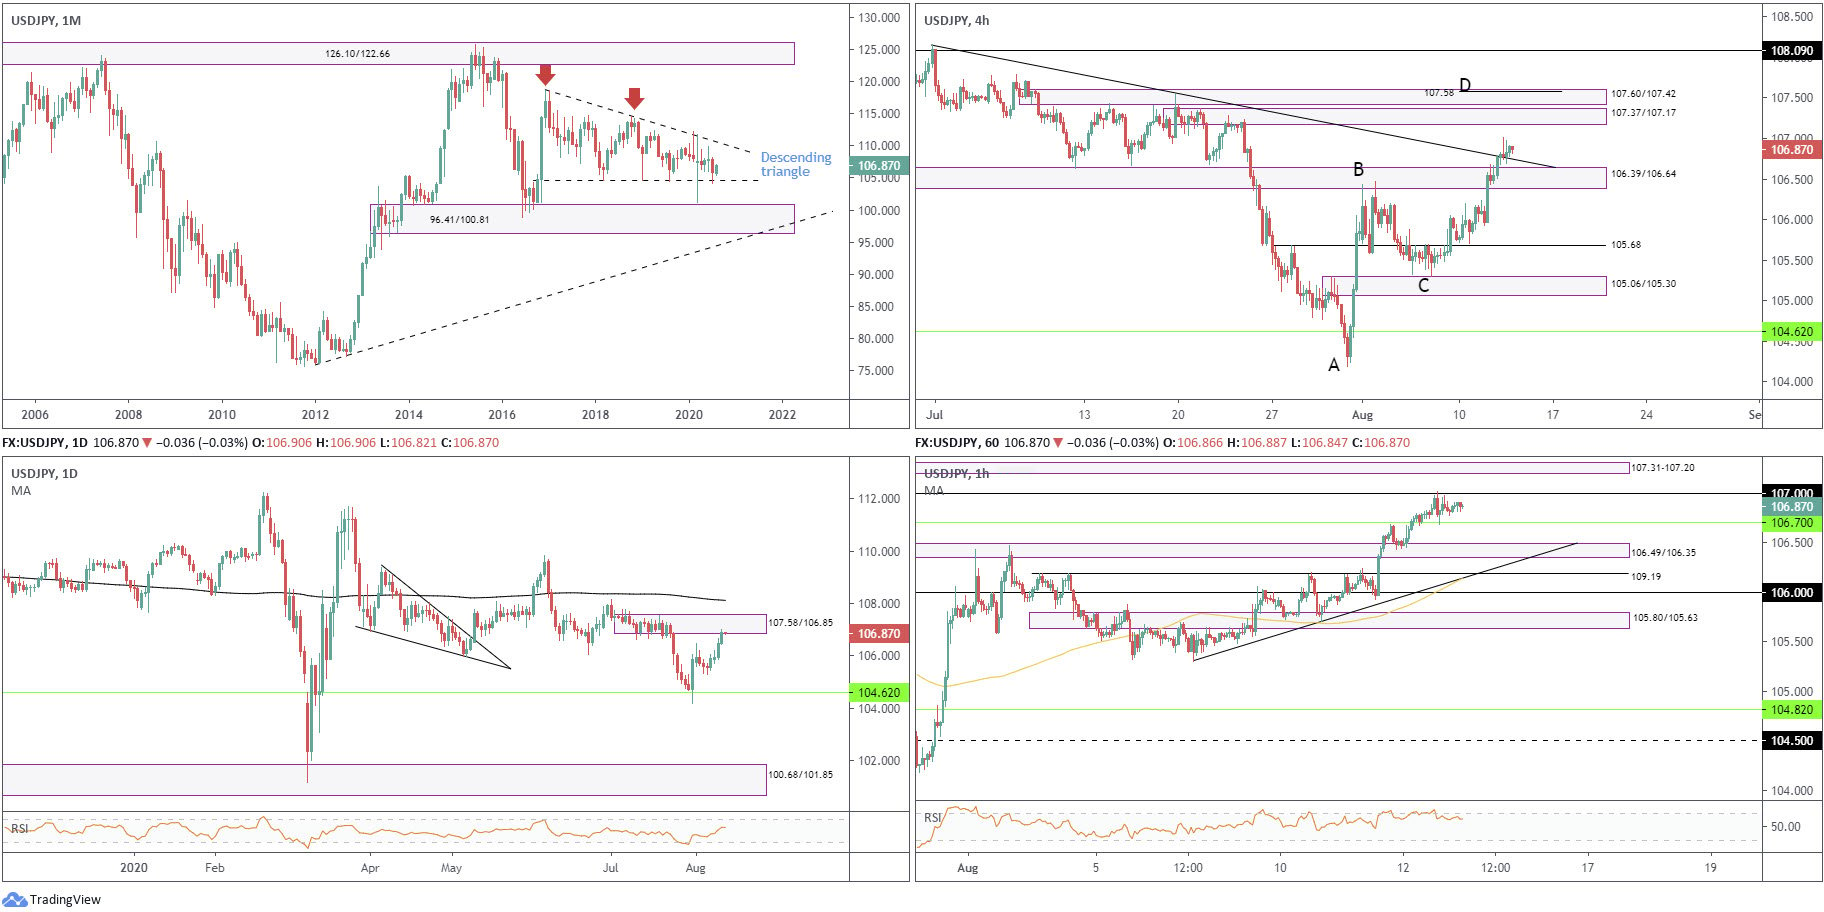
Since kicking off 2017, USD/JPY has been carving out a descending triangle pattern between 118.66/104.62.
April, May and June were pretty uneventful, with the latter wrapping up indecisively in the shape of a neutral doji candlestick pattern. July, nonetheless, sunk nearly 2 percent, consequently testing the lower boundary of the descending triangle.
August currently trades higher by 0.9 percent.
Areas outside of the noted triangle can be seen at supply from 126.10/122.66 and demand coming in at 96.41/100.81.
Daily timeframe:
Having monthly support at 104.62 make a show, daily price recently made contact with supply at 105.70/106.66.
Bulls are clearly in charge right now and, assuming a violation of current supply, could see buyers pursue resistance formed by way of the 200-day simple moving average at around 108.12.
The RSI value recently gave up its 50.00 line to the upside, with the pair’s candles pencilling in a fourth consecutive daily advance.
H4 timeframe:
Sponsored by decreased demand for safe-haven assets amid risk-on trade, supply at 106.39/106.64, as well as trendline resistance (108.16), was brushed aside in recent trading.
This throws light on two areas of supply today at 107.37/107.17 and 107.60/107.42, with the latter sharing its upper border with a possible ABCD bearish correction at 107.58.
H1 timeframe:
After an early retest at demand from 106.49/106.35 (prior supply), the recent ascent crossed paths with the 107 level and urged a 106.70 support retest.
Strengthening above 107 will likely see buyers work their way towards supply at 107.31/107.20.
Structures of Interest:
Coming off monthly support at 104.62, daily action now tests the mettle of supply coming in at 107.58/106.85. Notably, both H4 supply areas at 107.60/107.42 and 107.37/107.17 have a connection with the upper boundary of the aforesaid daily supply. Additionally, H1 supply at 107.31-107.20 inhabits H4 supply at 107.37/107.17.
With considerable supply in play (and ahead), upside momentum may diminish and provide countertrend traders an entry into the market. Harmonic traders will particularly favour the H4 ABCD correction at 107.58.
GBP/USD:
Monthly timeframe:
(Technical change on this timeframe is often limited though serves as guidance to potential longer-term moves)
GBP/USD finished higher by 5.5 percent in July, leading to long-term trendline resistance (1.7191) abandoning its position.
Despite the primary trend facing lower since early 2008, rupturing current trendline resistance could have buyers work towards another prominent trendline resistance (2.1161) over the coming weeks.
August has so far offered little movement, trading lower by 0.3% as of current price
Daily timeframe:
Brought forward from previous analysis –
After squeezing through the 200-day simple moving average (July 21), currently fluctuating around 1.2708, and toppling supply at 1.3021/1.2844, price action recently revisited the latter as a demand.To the upside, resistance at 1.3201 is seen as the next point of interest, south of a 161.8% Fib ext. level at 1.3264.
,p>The RSI oscillator, for those following momentum indicators, will note the value marginally exited overbought status, recently fading values as far north as 80.00.
H4 timeframe:
In recent trading, H4 tested a head and shoulder’s pattern (1.3170/1.3185/1.3132) neckline, drawn from 1.2981. A mild close under the neckline was seen, yet whether this was enough to stimulate sellers is difficult to judge at this point.
Technical structure, nonetheless, reveals demand at 1.2945/1.2989 is seen nearby, formed as part of stacked demand at 1.2948/1.2910. Also particularly noteworthy on this timeframe is the aligning trendline support (1.2259).
H1 timeframe:
Partially altered from previous analysis –
Dropping through 1.3050 in early trading Wednesday had the level serve as resistance throughout the session. This also shifts attention to the widely watched 1.30 level, reinforced by demand coming in from 1.2977/1.3000. This demand is considered significant on this timeframe, due to it representing an area where a decision was made to break above 1.30.
Structures of Interest:
Partially altered from previous analysis –
Monthly breaking trendline resistance emphasises an optimistic tone for GBP.
Daily price, on the other hand, reveals demand at 1.3021/1.2844 (prior supply) remains in sight, although buyers have yet to show much enthusiasm.
The H4 head and shoulder’s top pattern is also in view, with the associated neckline currently under fire. Breaking this line will likely see sellers make a play for lower levels.
H4 demand at 1.2945/1.2989 is also likely watched by many traders, along with connecting H4 demand at 1.2948/1.2910. Noting the 1.30 figure on the H1 inhabits territory just above H4 demand at 1.2945/1.2989 could see a whipsaw through the round number into the aforesaid demand (as well as H1 demand at 1.2977/1.3000). This, assuming a H1 close back above 1.30, may appeal to intraday buyers.

DISCLAIMER:
The information contained in this material is intended for general advice only. It does not take into account your investment objectives, financial situation or particular needs. FP Markets has made every effort to ensure the accuracy of the information as at the date of publication. FP Markets does not give any warranty or representation as to the material. Examples included in this material are for illustrative purposes only. To the extent permitted by law, FP Markets and its employees shall not be liable for any loss or damage arising in any way (including by way of negligence) from or in connection with any information provided in or omitted from this material. Features of the FP Markets products including applicable fees and charges are outlined in the Product Disclosure Statements available from FP Markets website, www.fpmarkets.com and should be considered beforedeciding to deal in those products. Derivatives can be risky; losses can exceed your initial payment. FP Markets recommends that you seek independent advice. First Prudential Markets Pty Ltd trading as FP Markets ABN 16 112 600 281, Australian Financial Services License Number 286354.


 Access +10,000 financial
instruments
Access +10,000 financial
instruments