
Technical analysis is an essential part of forex and CFD trading. It refers to the process of assessing chart patterns and predicting whether a currency pair will rise or not. Technical indicators are useful in doing this analysis. A trader can use hundreds of indicators to analyze charts and make informed decisions.
The difficulty of combining many indicators
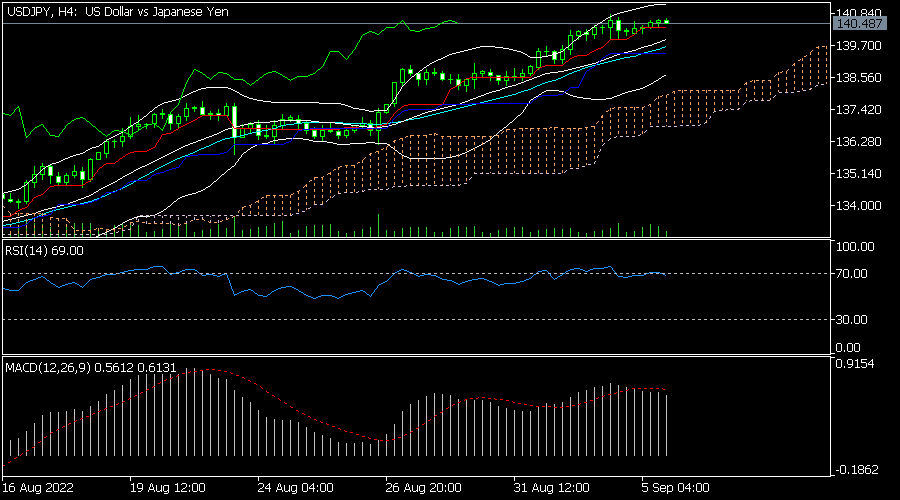
A common mistake that many forex traders do in technical analysis is using too many indicators in the same chart. Making informed decisions with all these tools is often impossible. For example, the chart below shows the difficulty of using five indicators in a single chart. This chart has the MACD, Relative Strength Index (RSI), Ichimoku, Bollinger Bands, and moving average.
Instead, many skilled and successful traders succeed by focusing on a small number of indicators. Some have even built their trading careers on a single indicator like the Volume Weighted Average Price (VWAP).
The three-screen system
There are several approaches how to combining multiple technical indicators to make better decisions in fx trading. One of the most popular strategies was proposed by Alexander Elder, a popular trader who has written a number of books on forex trading. He named it the three-screen system.
The concept behind this approach is based on the three popular types of indicators in technical analysis.
These types are:
– Trend indicators – These are indicators that are designed to follow an existing trend. They can also be used to identify when a new trend is emerging. Examples of these indicators are moving
averages, Bollinger Bands, and Ichimoku cloud.
– Oscillators or momentum – These indicators are used to show where a forex pair’s price is. These tools are often used to identify overbought and oversold levels. They include the
Relative Strength Index (RSI) and the Stochastic Oscillator.
– Volume indicators – These are indicators that introduce the concept of volume in a forex pair. This is important because a close analysis of volume flows can help you make better trading
decisions. Examples are the Money Flow Index (MFI), accumulation and distribution (A/D), and On Balance Volume (OBV).
Therefore, the three-screen system strategy refers to a strategy incorporating these three types of indicators in a chart.
How to use the three-screen strategy
There are a few steps to successfully use the three-screen strategy to combine multiple indicators in a chart. First, as part of your strategy and trading plan formulation, you need to identify your favourite technical indicators and their ideal settings.
For example, for moving averages, many traders prefer using the 25-period and 15-period exponential moving averages. Similarly, for an indicator like the RSI, your ideal settings could be a period of 14 and the overbought and oversold levels being at 70 and 30.
Second, depending on your trading strategy, you should then add the three indicators in your chart and do the analysis. You should then write down the combinations that are needed to execute a bullish or bearish trade.
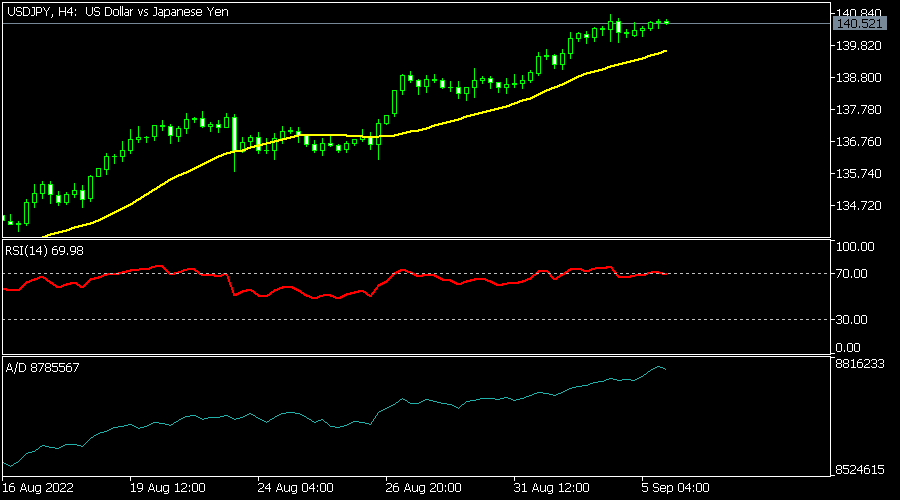
For example, assume that you are using a three-screen strategy with a 25-period moving average, Relative Strength Index, and accumulation and distribution indicator. In this case, you could execute a bullish trade when the price is above the moving average and when the two other indicators are pointing upwards as shown below.
Golden and death cross
Another ideal approach for conducting quality technical analysis is to combine two similar indicators. For example, you could combine two moving averages of different periods. A bullish signal emerges when the two moving averages make a crossover.
A death cross happens when the 50-period and 200-day moving average make a crossover above the price. A golden cross happens when the price is rising.
Pro tip
For day traders, 200-period and 50–period may not be ideal. Therefore, you can test smaller periods like 14 and 28.
Summary
Combining two or three indicators in fx trading can help you identify entry and exit positions. In this article, we have looked at two methods of combining these tools to make informed decisions. The three-screen system is a good one because it helps you identify when to buy and sell an asset.


 Access +10,000 financial
instruments
Access +10,000 financial
instruments