
Reading time: 10 Minutes
History
Candlestick charts are claimed to have been created in the 18th century by Japanese rice trader Munehisa Homma. In 1991, Japanese Candle Charting Techniques, written by Steve Nison (Amazon.com), served as an introduction to the west. This book includes a wealth of information you can use as a resource for investing techniques using candlestick analysis.
Steve Nison dedicated years to studying and researching Japanese candle charting techniques: He familiarized himself with the vocabulary and ideas of the Japanese language and charting techniques.
Reading Candlestick Charts
The three main charts used among technical analysts are the line chart, the bar chart and, of course, the candlestick chart. Beginner traders tend to be drawn to candlestick charts, whether they trade stocks, Forex (FX trading), indices, commodities, and so forth.
A candlestick, sometimes referred to as Forex candlesticks, comprises five main elements: The upper and lower shadows (wicks or tails), the open and close, and the real body (candle body), as illustrated in figure 1.A.
 Figure 1.A. Courtesy of FP Markets
A line chart is constructed in the form of a continuous line, generally made up of closing prices. A bar chart is similar to a candlestick chart but differs slightly from a candlestick chart in that it is void of a real body (it’s simply displayed as a vertical line, similar to upper and lower shadows). Candlestick charts can be any color: green and red candles are popular candlestick colors.
Customizing candlestick charts is straightforward if you’re using MetaTrader 4 or 5 (MT4 or MT5). Right-click on your MT4 or MT5 chart, and you will be presented with the properties window, and then select the different options specific to you and click ok; the changes will be displayed on your chart. It’s a good idea to familiarize yourself with different colors and options and find the colors you are comfortable with as you may be viewing the screen for long periods. Create a set-up that is easy on the eyes. However, there is a reset button; if you get confused, click Reset, and it will reset the chart to the default settings.
It is essential to acknowledge that a candlestick frequency rests on the period (or timeframe) the trader has selected. For example, a 60-minute candlestick chart will result in 1 candlestick forming each hour: 24 candlesticks in a trading day, and so on.
Candlestick Components
- Wicks or Tails
A shadow, wick, or tail is a small line located at the candle’s top or bottom, varying in length depending on the market activity (trading conditions). The wick shows where the price of a stock has fluctuated relative to the opening and closing prices. Essentially, these shadows illustrate the highest and lowest prices a security has traded over a specific period.
- Real Body
The rectangular part of the candlestick is called the “real body.” The real body shows the range of prices between when the market opened and when it closed for the day (assuming daily candles). By viewing the height and color of the real body, there is a visible sign if the bulls or bears are dominating.
- The Open and Close.
When there is no real body, or the real body is very small (spinning top shape, for example), it denotes the open and close prices are the same or almost the same. When the real body is black (assuming we have selected black candles to represent a bearish setting), the close is lower than the open. If the real body is empty (or white), the close will be seen as higher than the open.
Types of Candlestick Patterns
Bullish and Bearish Candlestick Patterns:
- A bullish candlestick pattern is when the price of an asset begins trading at one level and ends at a higher level. This is usually represented by an unfilled candle (white).
- A candlestick is considered bearish when its color is black or red, depending on how you have your chart set up in terms of colors, indicating that its close price is lower than its open price.
Japanese Candlestick Chart Patterns
There are many candlestick patterns, but we will cover some of the most popular ones in this article.
Single Candle Patterns:
- The Hammer Candlestick
The Japanese word for hammer candlestick is takaru (trying to feel the bottom). Consisting of a single candlestick, hammers possess a long lower wick and a small body on the top (Figure 1.B.) with a very small or no upper wick. Do note that the lower wick must be at least two-thirds the size of the real body.
A hammer candlestick pattern indicates the probability of a price reversal. Hammer patterns are considered valid during bearish trends and suggest that the price might soon reverse to the upside. A reversal pattern can be either bearish or bullish, depending on what directional move came before. There is also the hanging man candlestick pattern (same construction as the hammer pattern but offers a bearish indication) which forms after an uptrend. Another valid candlestick pattern is the shooting star: a mirror opposite to the hammer pattern and indicates a bearish signal after an up move.

Figure 1.B. Image ID: 2163601519
- The Doji Candlestick
The Doji candle, which has no body and looks like a dash, often indicates a period of indecision or an upcoming price reversal, depending on its position on the chart. A single candle pattern that is neither bearish or bullish represents a neutral state as the price closes at exactly where it opened because both these pressures have reached equilibrium.
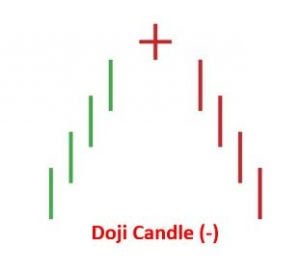 Figure 1.C. Image ID: 2201912121
Double Candle Patterns:
These patterns consist of two Japanese candlesticks.
Engulfing Candlestick Patterns:
The engulfing pattern is a reversal signal consisting of 2 real bodies, as shown in figure 1.D.
- Bearish Engulfing Pattern
In figure 1.D, we can see that the market is trending higher prior to the formation of a bearish engulfing formation. This is a prerequisite for the bearish engulfing pattern. Importantly, with bearish engulfing patterns, we focus on the real bodies of the candle, not the range. The small blue real body is engulfed by the larger red body, showing supply has overwhelmed demand and delivered a valid bearish engulfing scenario that informs candlestick users that further selling could emerge.
- Bullish Engulfing Pattern
In a falling market, the blue larger candle engulfs the smaller-bodied red candle, indicating more buyers than sellers and that additional buying could be seen. A downtrend must be present for this candle pattern to be considered valid.
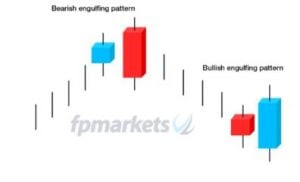 Figure 1.D. Courtesy of FP Markets
Triple Candle Patterns:
These patterns consist of three Japanese candlesticks.
The Morning Star Pattern
This pattern forms during bearish trends and signals an upside reversal beginning with a bearish candle followed by a smaller, bullish candle that gaps down past the previous range. A larger bullish candle is formed when the price gaps up. This third candle should cover at least half the body size of the first candle, as shown in figure 2.A. Once this completes, this is considered a bullish signal.
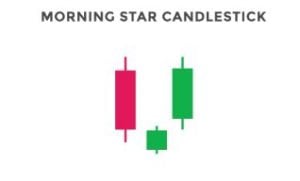 Figure 2.A. Image ID: 2163599541
The Evening Star Pattern
The evening star pattern appears during bullish trends and signals a downside reversal. Here a bullish candle is followed by a smaller bearish or bullish candle that gaps up. This then leads to the price gapping down and forming a third bearish candle which should cover approximately half the body size of the first candle, as shown in figure 2.B.
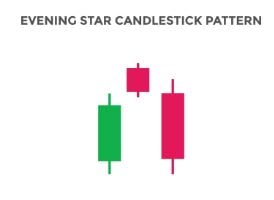 Figure 2.B. Image ID: 2163600519
There are numerous candlestick patterns; this article has just touched the surface. Creating and following a trading plan is advisable when establishing a candlestick trading strategy. For beginner traders, starting with a demo account from a fully regulated broker, such as FP Markets, is advisable to learn the fundamentals and familiarize yourself with all the above.


 Access +10,000 financial
instruments
Access +10,000 financial
instruments